Large graphs and iSAM2
131 views
Skip to first unread message

Zack
Oct 7, 2021, 5:11:37 AM10/7/21
to gtsam users
I am dealing with very large graphs with data streams which can be running for up to 30 minutes. This causes some problems optimising the graph without reaching -NaN or Levenberg Marquardt cannot decrease error with maximum lambda printouts. I got around this by changing the node ordering system to METIS and optimising the graph every X nodes added.
This seems to work but I am aware how sensitive to outliers this is so I have been looking at iSAM2. However, I get the same problem as before where if there are too many nodes I get an indeterminant system error. I cannot seem to find a way to set the nodes to METIS in order to get around that problem.
I have thought about breaking up the graph into multiple iSAM2 graphs (maybe tricky dealing with IMU factors and loop closure) to see if that solves things. Is there a better way, or something someone has already proven to work for large graphs with iSAM2?

dav...@oxfordrobotics.institute
Oct 7, 2021, 9:54:40 AM10/7/21
to gtsam users
A common approach is to split the problem into two graphs:
1) A smaller graph with high frequency measurements
2) A global pose graph for incorporating loop closures.
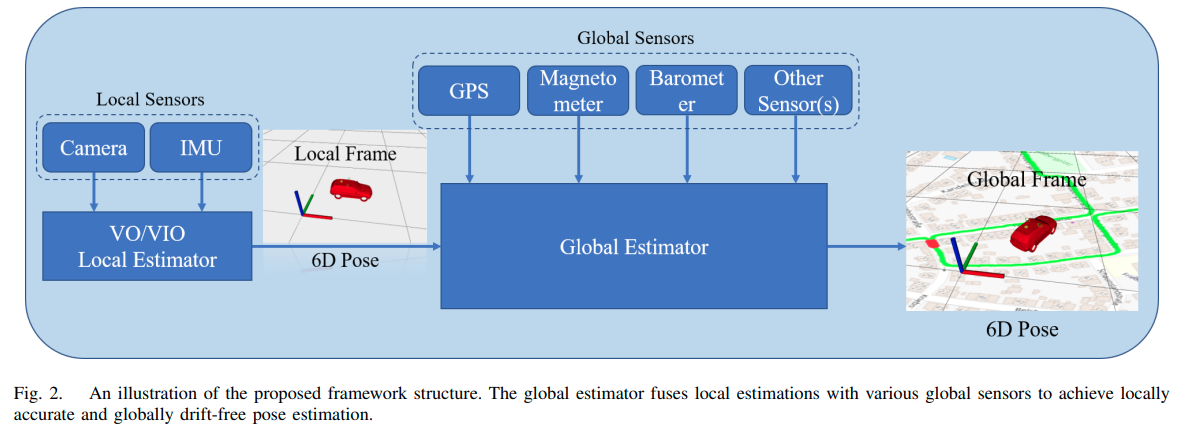
Here's an example system diagram from VINS-Fusion which takes this approach:
Zack
Oct 7, 2021, 10:37:06 AM10/7/21
to gtsam users
Thanks, yes that does make a lot of sense. However, from the above image can the IMU biases be correctly computed for low cost IMU using IMU alone? Or would it require visual odometry in order to work that out.
dav...@oxfordrobotics.institute
Oct 7, 2021, 11:54:11 AM10/7/21
to gtsam users
You usually need another input to make the IMU biases observable - this could be visual odometry, loop closures, priors, etc. Depends on the problem you are trying to solve.
Reply all
Reply to author
Forward
0 new messages