Troubleshooting for no significance in GSEA
27 views
Skip to first unread message

Leo
Apr 25, 2023, 9:40:53 AM4/25/23
to gsea-help
Hi,
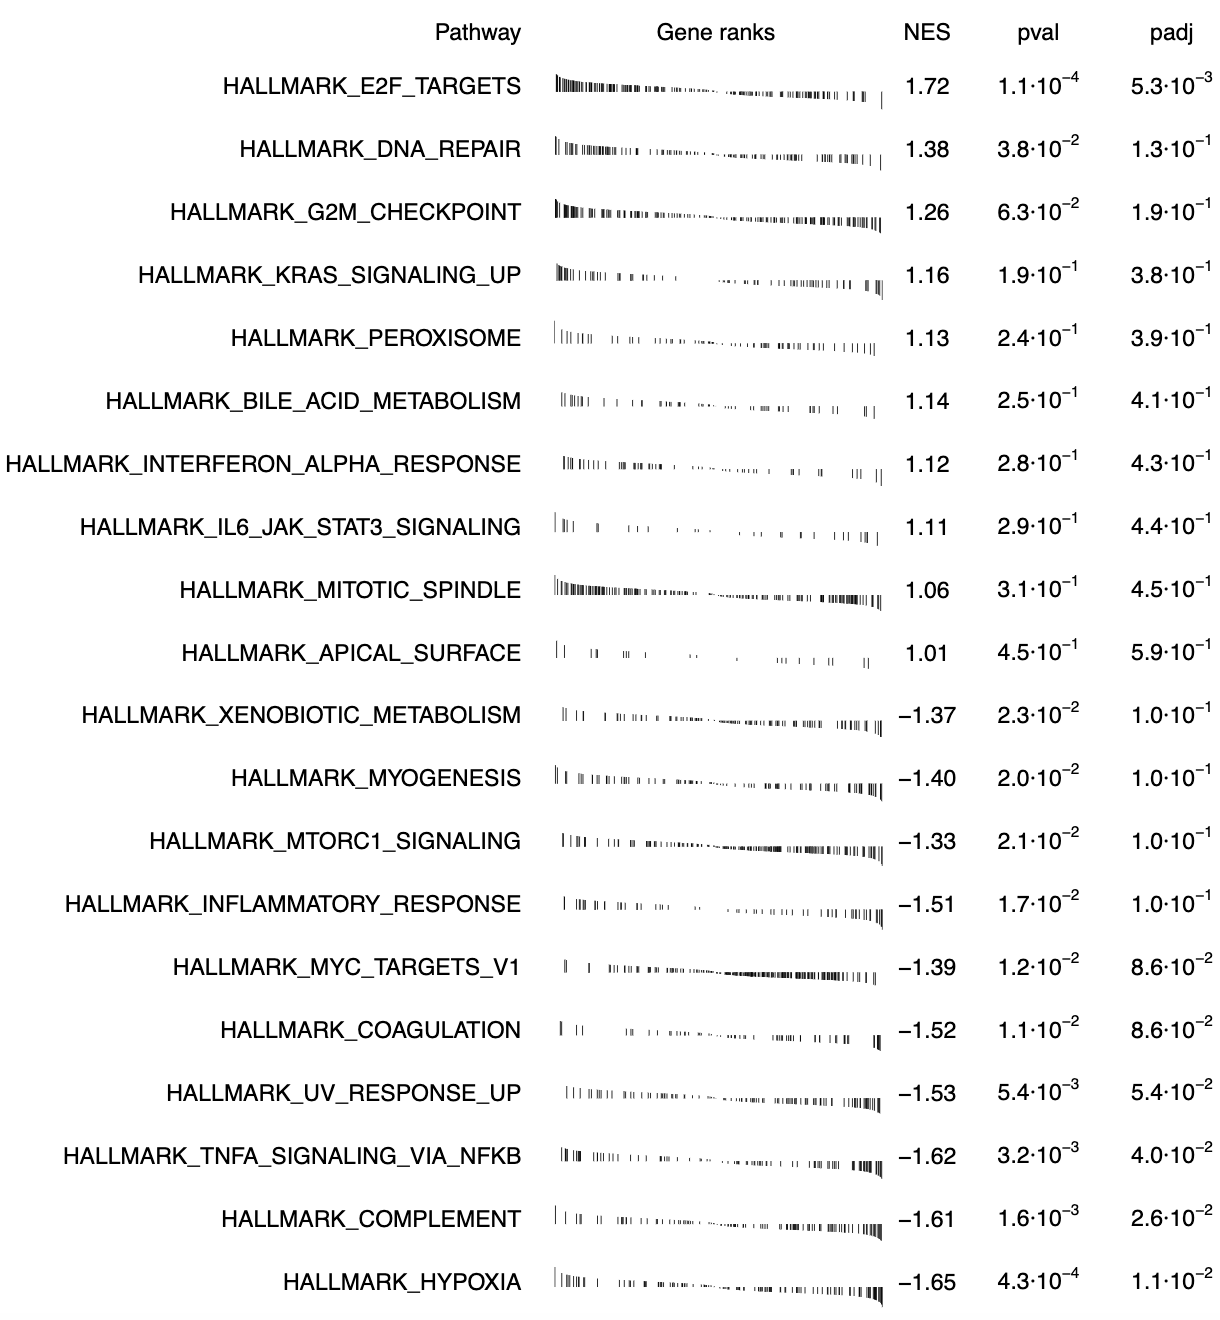
I am using GSEA for proteomics data. Although there is strong enrichment in cell cycle-related GO terms in gene ontology enrichment analysis (input the up or down-regulated protein names |log2FC| > 1, padj < 0.1), the GSEA did not show the significance in cell cycle-related hallmark gene sets (e.g. HALLMARK_G2M_CHECKPOINT, HALLMARK_MITOTIC_SPINDLE, like following plot). The GSEA was done by inputting the whole protein list (total 9942). The list was ranked by log2FC. May I ask if there is anything I did wrong or any troubleshooting that I could do?
GSEA results:
GSEA code:
MDA231_ranked_genelist_input <- MDA231_ranked_genelist$log2fc
names(MDA231_ranked_genelist_input) <- MDA231_ranked_genelist$name
H <- msigdbr(species = "Homo sapiens", category = "H")
H.gene_symbol.ls <- H %>%
dplyr::select(gs_name, human_gene_symbol) %>%
group_by(gs_name) %>%
summarise(all.genes = list(unique(human_gene_symbol))) %>%
deframe()
names(MDA231_ranked_genelist_input) <- MDA231_ranked_genelist$name
H <- msigdbr(species = "Homo sapiens", category = "H")
H.gene_symbol.ls <- H %>%
dplyr::select(gs_name, human_gene_symbol) %>%
group_by(gs_name) %>%
summarise(all.genes = list(unique(human_gene_symbol))) %>%
deframe()
MDA231_gsea.H <- fgsea(pathways = H.gene_symbol.ls,
stats = MDA231_ranked_genelist_input)
topPathwaysUp <- MDA231_gsea.H[ES > 0][head(order(padj), n=10), pathway]
topPathwaysDown <- MDA231_gsea.H[ES < 0][head(order(padj), n=10), pathway]
topPathways <- c(topPathwaysUp, rev(topPathwaysDown))
plotGseaTable(H.gene_symbol.ls[topPathways], MDA231_ranked_genelist_input, MDA231_gsea.H,
gseaParam=0.5)
Best wishes,
Leo

David Eby
May 2, 2023, 12:14:35 PM5/2/23
to gsea...@googlegroups.com
Hi Leo,
The code that you have sent is for fgsea, which is an independent implementation and not something we built or can directly support. I would suggest you reach out to them at the GitHub location listed on their Bioconductor page.
Alternatively, you could try doing a similar experiment with our GSEA Desktop in Preranked mode and see how that works out.
Regards,
--
You received this message because you are subscribed to the Google Groups "gsea-help" group.
To unsubscribe from this group and stop receiving emails from it, send an email to gsea-help+...@googlegroups.com.
To view this discussion on the web visit https://groups.google.com/d/msgid/gsea-help/249dcc1d-451b-4049-b864-5ae3fc1c993dn%40googlegroups.com.
Reply all
Reply to author
Forward
0 new messages