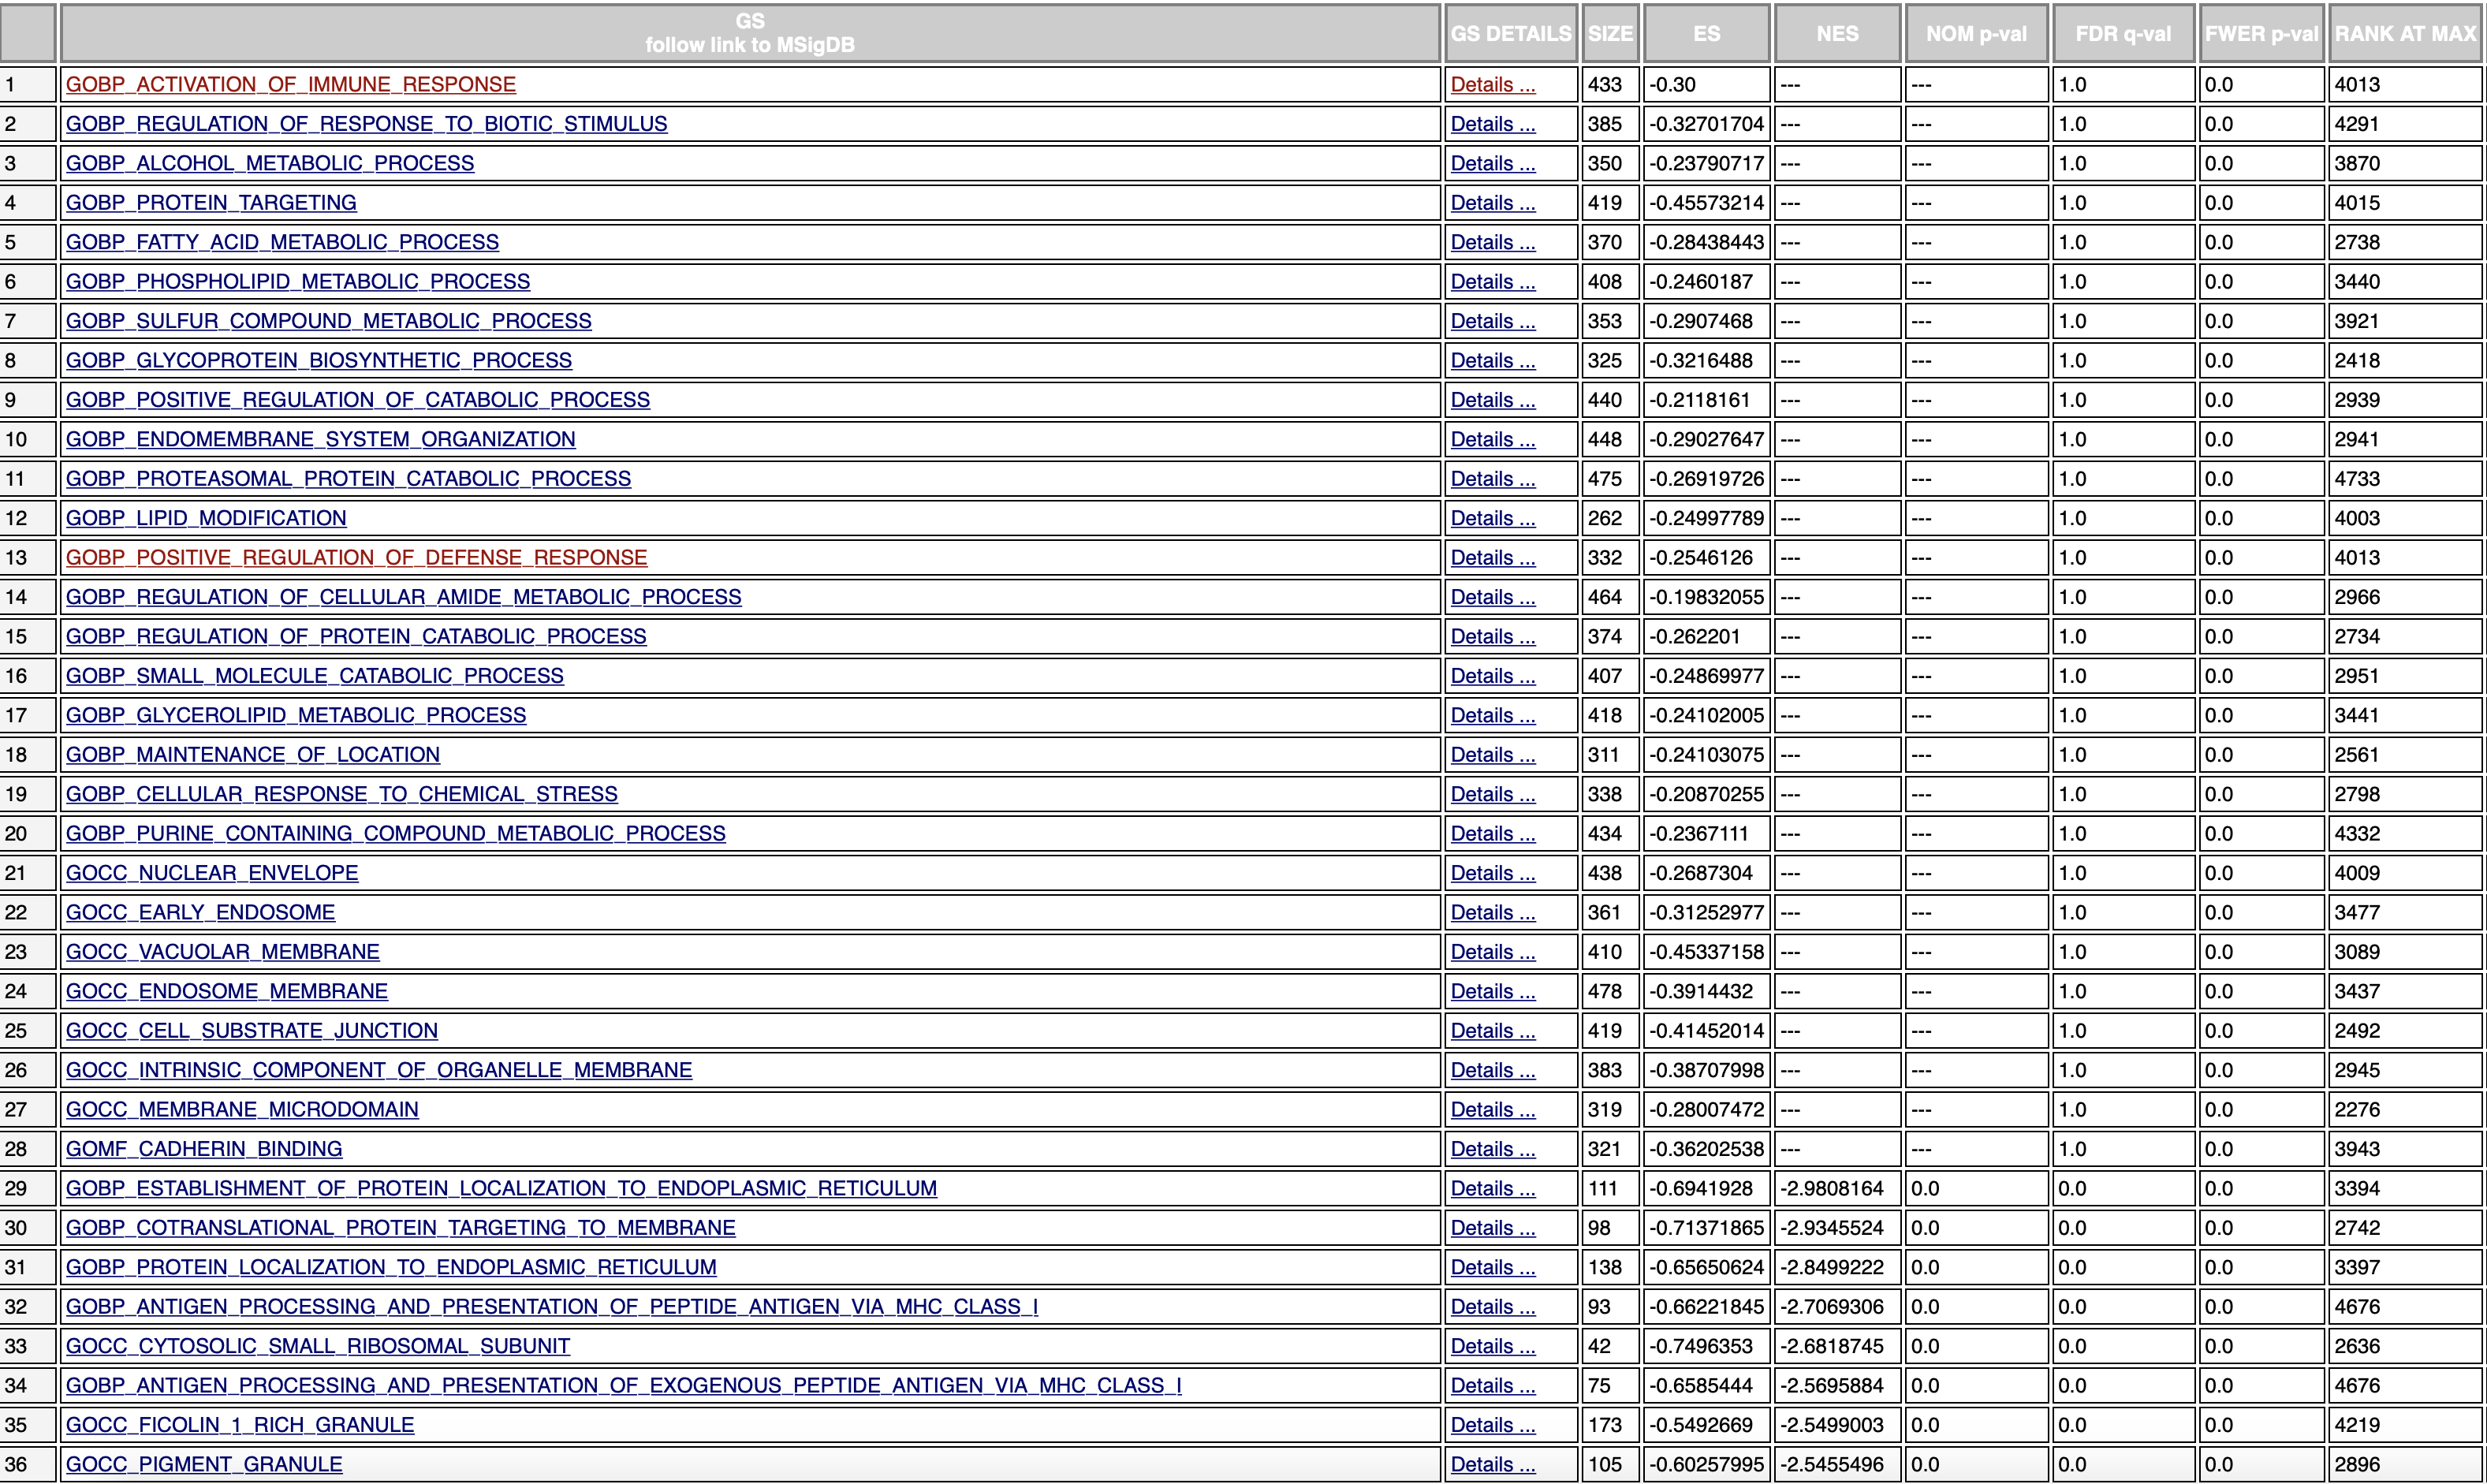
missing NOM p-val

席甲甲

Anthony Castanza
Hi Jiajia,
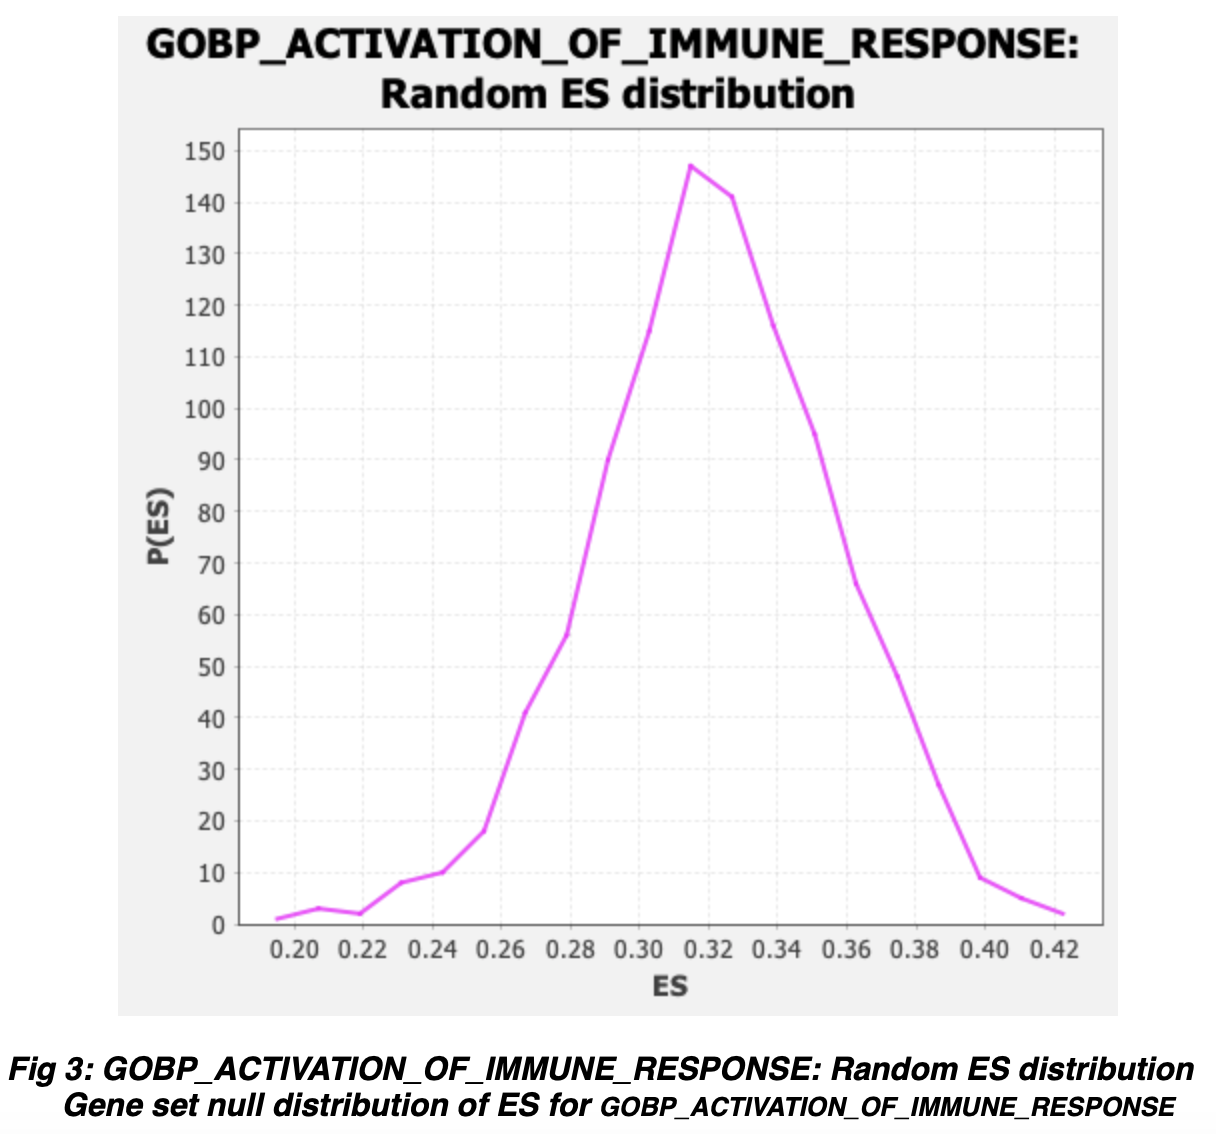
The explanation for this is fairly complicated, when GSEA produces a null distribution of enrichment scores for random permutations of the data, the null distribution has a positive and negative component. GSEA compares the true enrichment score of the gene set to the side of this distribution with the same sign. In rare cases, all of the null distribution will be on one side, if that side is the opposite sign of the true enrichment score, GSEA will get a NaN in its pValue calculation function.
This most frequently occurs when there is a large skew in the underlying expression data, but GSEA found a putative enrichment on the opposite side of the skew (the small side), and when gene set permutation is used, it can be difficult to sample enough random genes from the smaller side to actually produce a null distribution for that side.
Were you running in Gene Set permutation mode? If so, can you try increasing the number of permutations to 10,000 instead of the default 1000?
It's worth noting that the FDRs for those dets aren't valid either.
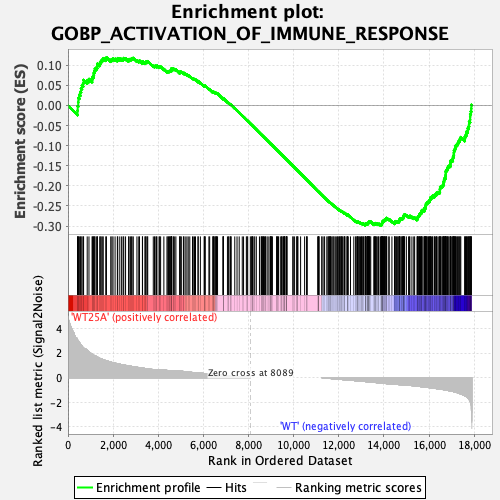
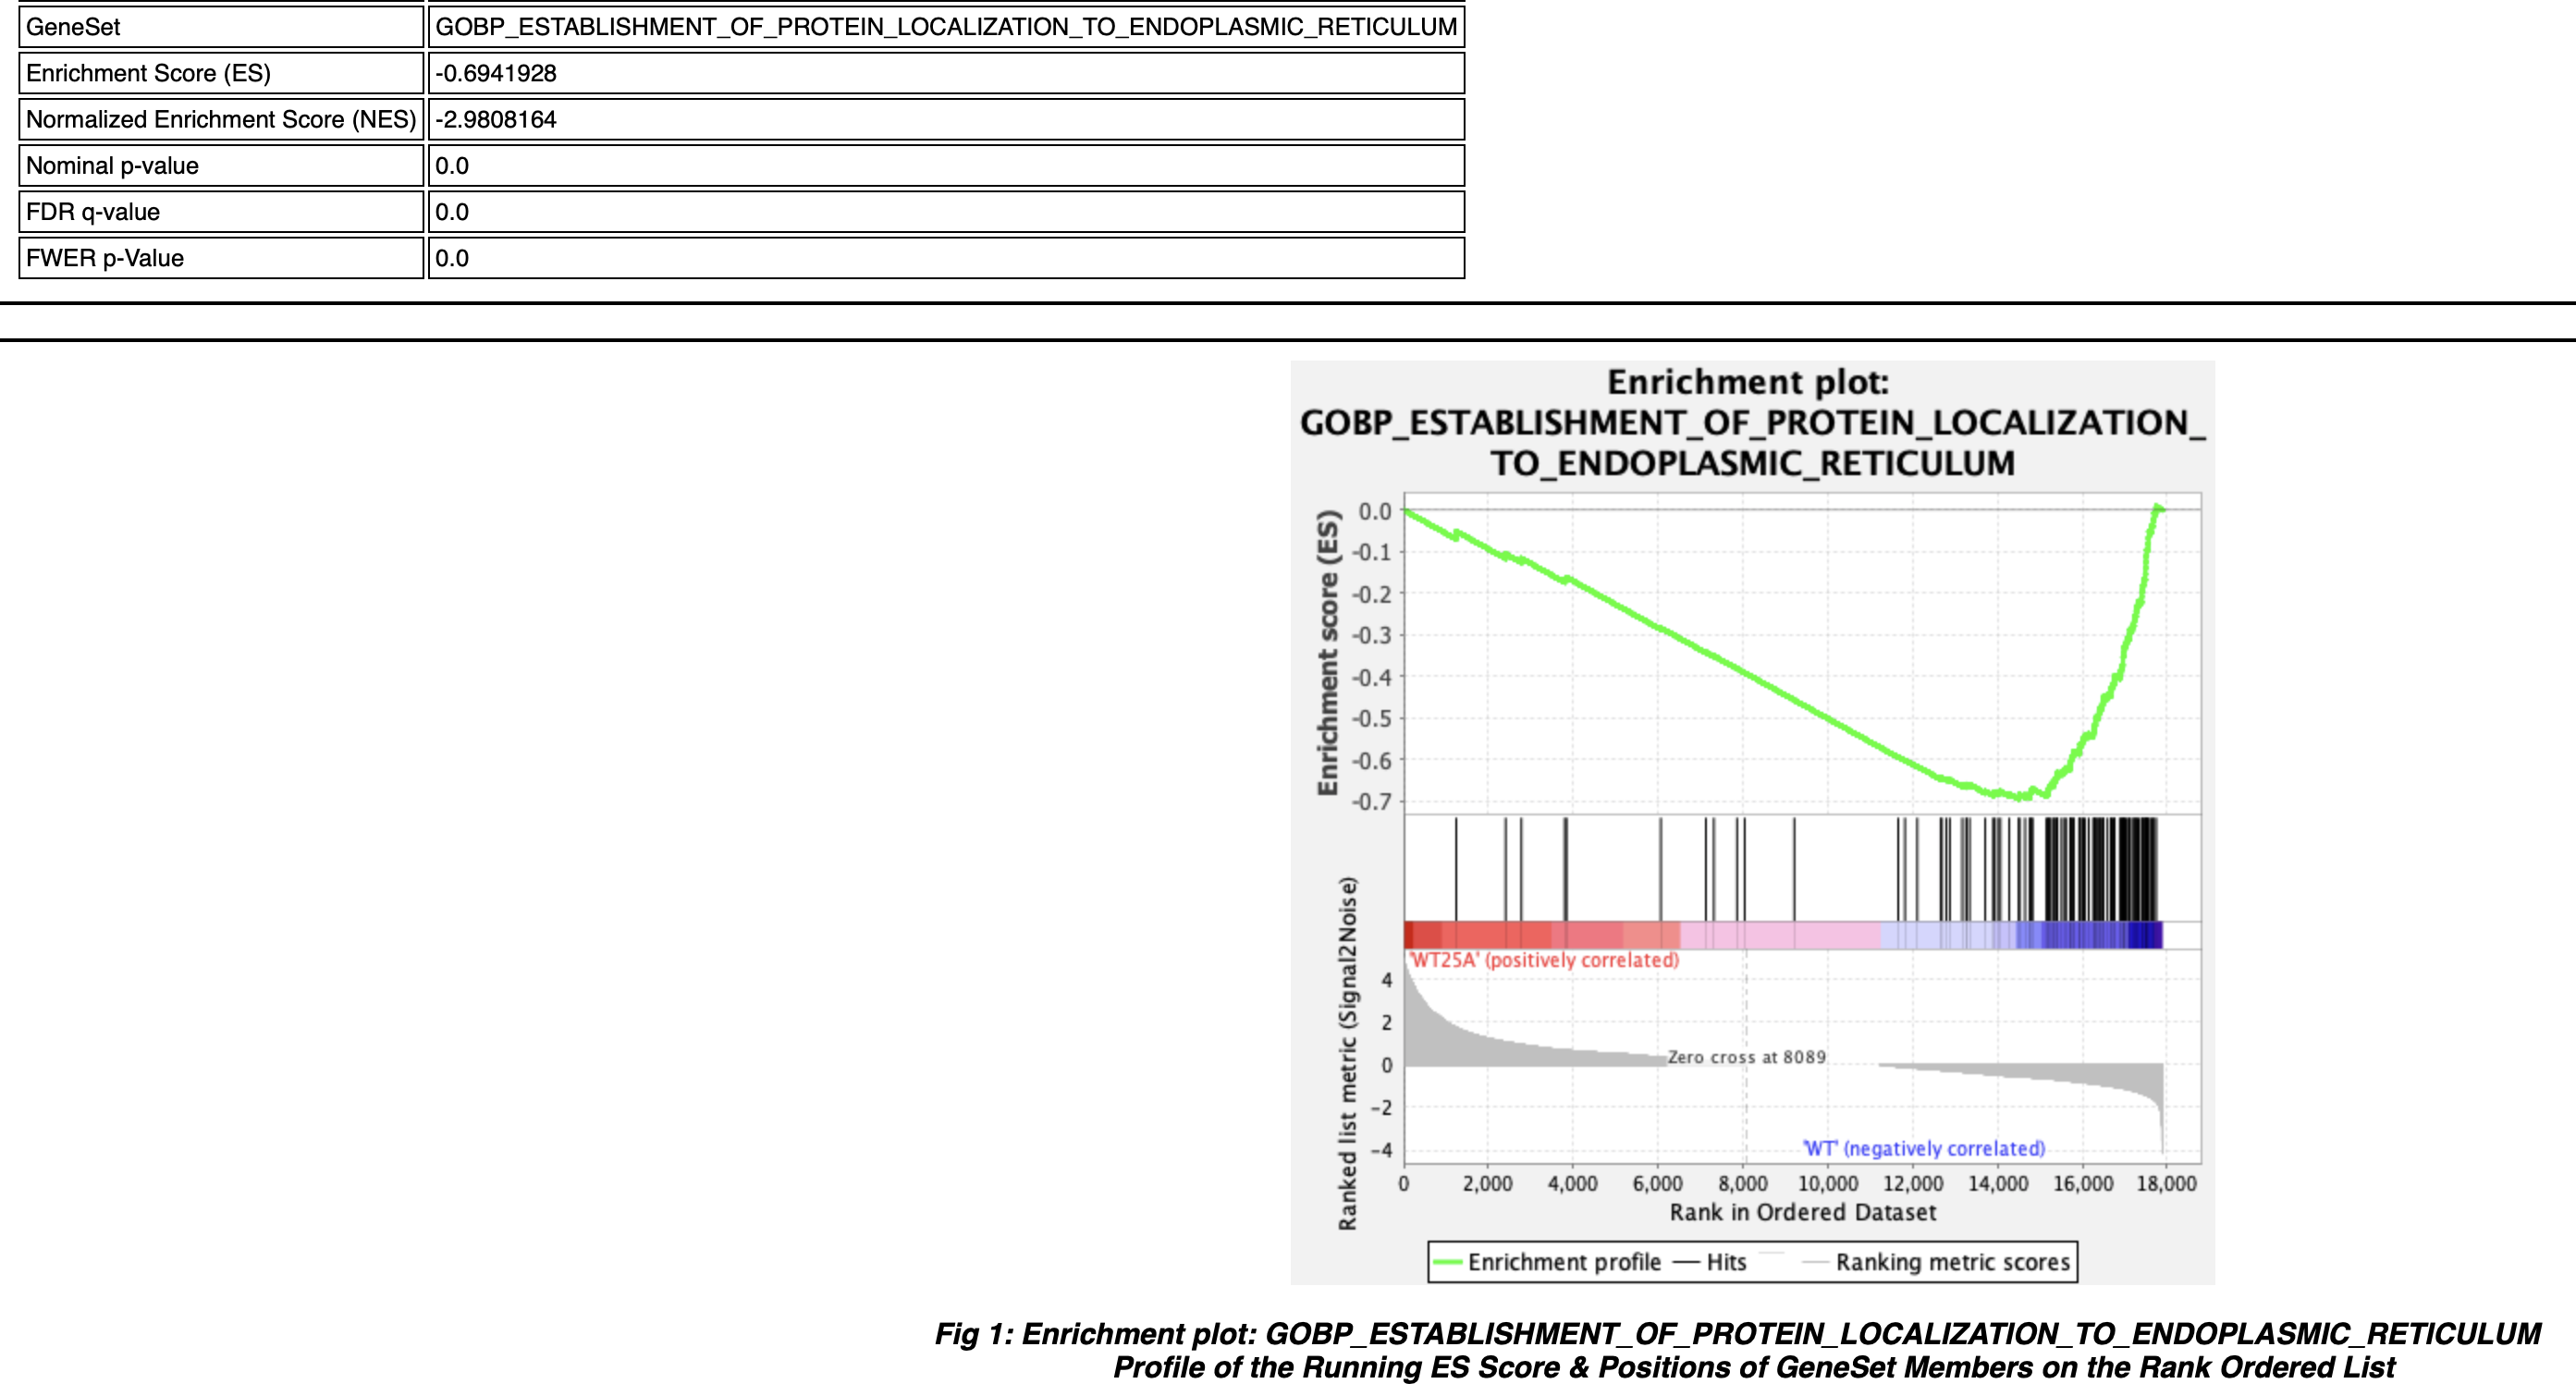
Can you send us an enrichment plot from one of the gene sets that returned a "---" as well as the associated "Random ES distribution" plot, similarly, those two plots from one of the negative enrichment score gene sets that did return valid values? That will help confirm that this distribution error is in fact what occurred here.
Thanks
-Anthony
Anthony S. Castanza, PhD
Curator, Molecular Signatures Database
Mesirov Lab, Department of Medicine
University of California, San Diego
--
You received this message because you are subscribed to the Google Groups "gsea-help" group.
To unsubscribe from this group and stop receiving emails from it, send an email to
gsea-help+...@googlegroups.com.
To view this discussion on the web visit
https://groups.google.com/d/msgid/gsea-help/3b82f584-6f5a-486b-80b1-fbfb9c444db9n%40googlegroups.com.
