interpretation results

Tuba Uslu
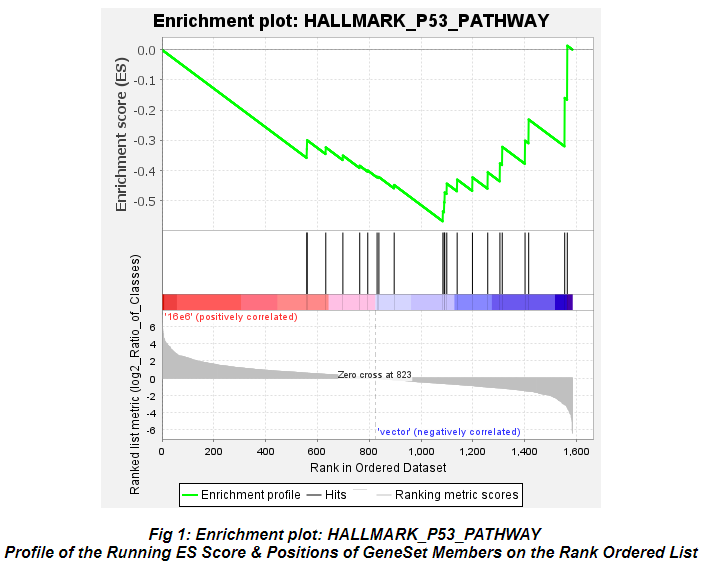
I can't understand the table: because when I look at the table I am told that the class is upregulated in the "vector" class, but in the graph it is the opposite (the curve decreases for "vector") . Please help me interpret my results. here is an example:


Castanza, Anthony
Hello,
This is the expected presentation of these results. When you run GSEA it, internally, computes differential expression between your two classes (in this case 16e6 vs. vector), so genes that are more highly expressed in the 16e6 samples are positively differentially expressed and genes that are more highly expressed in the vector (i.e. low in 16e6) are negatively differentially expressed. So when GSEA calculates enrichments, gene sets that on balance contain positively differentially expressed (in 16e6) genes receive positive enrichment scores and are reported as enriched in the positive phenotype, gene sets that contain primarily negatively differentially expressed genes receive negative enrichment scores and are reported as enriched in the negative phenotype (i.e. vector). Does that make sense?
I would also note here that you appear to only have ~1600 genes in your data. GSEA generally expects the full information for all expressed genes. Highly restricted datasets such as this can provide unreliable results due to the nature of the internal gene universe filtering that GSEA performs. You’ll want to sure that a reasonable percentage of the original gene set is present in the expression file you’re providing. The pre and post filtering statistics are reported in the gene_set_sizes.tsv file included in the GSEA results.
Let me know if you have additional questions!
-Anthony
Anthony S. Castanza, PhD
Curator, Molecular Signatures Database
Mesirov Lab, Department of Medicine
University of California, San Diego
From: Tuba Uslu
Sent: Wednesday, May 24, 2023 6:21 AM
Subject: [gsea-help] interpretation results
Hello,
I can't understand the table: because when I look at the table I am told that the class is upregulated in the "vector" class, but in the graph it is the opposite (the curve decreases for "vector") . Please help me interpret my results. here is an example:
Thank you
Best,
Tuba ,
--
You received this message because you are subscribed to the Google Groups "gsea-help" group.
To unsubscribe from this group and stop receiving emails from it, send an email to gsea-help+...@googlegroups.com.
To view this discussion on the web visit https://groups.google.com/d/msgid/gsea-help/06a9823b-32dc-4eed-998c-0f7abc3a50fan%40googlegroups.com.
Tuba Uslu
You received this message because you are subscribed to a topic in the Google Groups "gsea-help" group.
To unsubscribe from this topic, visit https://groups.google.com/d/topic/gsea-help/8xrAafboV_M/unsubscribe.
To unsubscribe from this group and all its topics, send an email to gsea-help+...@googlegroups.com.
To view this discussion on the web visit https://groups.google.com/d/msgid/gsea-help/A3B7D7F0-8B2C-4B6A-AAE5-07F9937F31E4%40hxcore.ol.
Castanza, Anthony
So in this example, the P53 pathway is downregulated in your 16e6 treatment, which, because differential expression is reciprocal, means that it is reported as upregulated in the vector (in comparison to the treatment).
--
You received this message because you are subscribed to the Google Groups "gsea-help" group.
To unsubscribe from this group and stop receiving emails from it, send an email to gsea-help+...@googlegroups.com.
To view this discussion on the web visit https://groups.google.com/d/msgid/gsea-help/06a9823b-32dc-4eed-998c-0f7abc3a50fan%40googlegroups.com.
--
You received this message because you are subscribed to a topic in the Google Groups "gsea-help" group.
To unsubscribe from this topic, visit https://groups.google.com/d/topic/gsea-help/8xrAafboV_M/unsubscribe.
To unsubscribe from this group and all its topics, send an email to gsea-help+...@googlegroups.com.
To view this discussion on the web visit https://groups.google.com/d/msgid/gsea-help/A3B7D7F0-8B2C-4B6A-AAE5-07F9937F31E4%40hxcore.ol.
--
You received this message because you are subscribed to the Google Groups "gsea-help" group.
To unsubscribe from this group and stop receiving emails from it, send an email to gsea-help+...@googlegroups.com.
To view this discussion on the web visit https://groups.google.com/d/msgid/gsea-help/CAEVxrj%3Dbbo_5vpBJmsD2rFRqCmcb7%2B91CCYV8%2BoGxvx4Xu68iA%40mail.gmail.com.
Tuba Uslu
To view this discussion on the web visit https://groups.google.com/d/msgid/gsea-help/EA27734A-E9ED-47CC-95DE-4AC13163833D%40hxcore.ol.
Castanza, Anthony
No. The enrichment score is always reported with respect to the positive phenotype, in this case 16e6. But the “enriched in phenotype” is reported with respect to which phenotype is actually expressing the bulk of those genes, in this case vector.
You computed differential expression for 16e6 vs. vector. 16e6 is the positive phenotype. Vector is the negative phenotype.
Genes that are “upregulated” are upregulated in 16e6 compared to vector, but this is reciprocal those same genes are simultaneously downregulated in vector compared to 16e6. Because it is a differential.
The pathway is downregulated in the differential calculation because its genes are downregulated in the 16e6 vs vector comparison. So they are expressed less in 16e6 than they are in the vector. So, we report a negative enrichment score for the 16e6 vs. vector comparison for this pathway, and report that it is, therefore, enriched in the vector phenotype as that is the phenotype where the majority of the genes are most highly expressed.
To view this discussion on the web visit https://groups.google.com/d/msgid/gsea-help/CAEVxrjm3o6DsHUgCNzu-BFpvoF0AW8e2apMhFOaaT%3D7QkaPpBA%40mail.gmail.com.