Tinkerpop graph visualization

Anthony Cros
Hi!
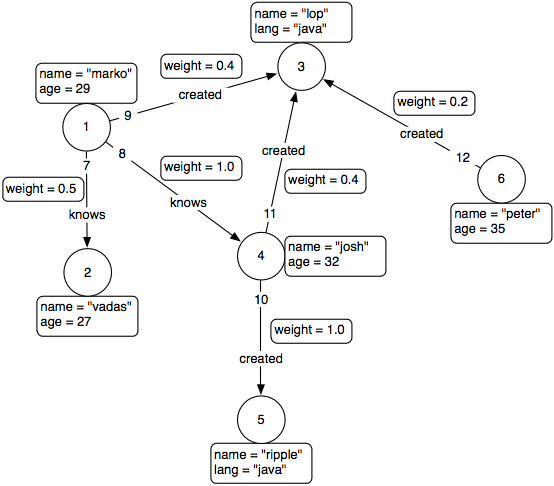
I've been googling around all morning and can't seem to find a way to visualize a relatively simple graph, something that would look like this (ironically found on https://github.com/tinkerpop/blueprints/wiki/GraphSON-Reader-and-Writer-Library):

Daniel Kuppitz
--
You received this message because you are subscribed to the Google Groups "Gremlin-users" group.
To unsubscribe from this group and stop receiving emails from it, send an email to gremlin-users+unsubscribe@googlegroups.com.
To view this discussion on the web visit https://groups.google.com/d/msgid/gremlin-users/badc5aed-7214-4bb8-ac8d-a429639b3c85%40googlegroups.com.
For more options, visit https://groups.google.com/d/optout.
Anthony Cros
On Tuesday, November 29, 2016 at 11:13:13 AM UTC-5, Daniel Kuppitz wrote:
All the toy graph visualizations in the docs were created by hand (a hand named Marko). To create visualizations automatically, you can use the Gephi Plugin.Cheers,Daniel
On Tue, Nov 29, 2016 at 5:01 PM, Anthony Cros <cros.a...@gmail.com> wrote:
Hi!
I've been googling around all morning and can't seem to find a way to visualize a relatively simple graph, something that would look like this (ironically found on https://github.com/tinkerpop/blueprints/wiki/GraphSON-Reader-and-Writer-Library):
http://www.tinkerpop.com/docs/3.0.0.M1/#_gremlin_i_o describes a few serialization formats but none that seem to allow creating such a visualization. GraphML seems too lossy and I can't find a tool that would turn GraphSON into an image like the above's, nor one that would support a kryo dump. It also looks like Rexter Dog House isn't supported anymore, and the replacement "Dashboard" mentioned in https://groups.google.com/forum/#!topic/gremlin-users/rqdM-aR7TWA seems not to have happened in the end.Any suggestions?Thanks,Anthony
--
You received this message because you are subscribed to the Google Groups "Gremlin-users" group.
To unsubscribe from this group and stop receiving emails from it, send an email to gremlin-user...@googlegroups.com.

Jean-Baptiste Musso
To unsubscribe from this group and stop receiving emails from it, send an email to gremlin-users+unsubscribe@googlegroups.com.
To view this discussion on the web visit https://groups.google.com/d/msgid/gremlin-users/258a8f8e-8329-44d3-bf0d-868a9af65690%40googlegroups.com.

Umesh Jayasinghe
Hi,
If you are starting a tinkerpop server, you can use thhis is a tool (like how neo4j visualize) I've created to visualize gremlin queries. You should execute a query to get a set of nodes and it will show you how those nodes are getting connected. You can execute multiple queries and results would add up to the existing graph until you clear the graph. You can also click on a node/edge to see the properties or traverse in/out. Give it a go! Cheers!

Stephen Mallette
--
You received this message because you are subscribed to the Google Groups "Gremlin-users" group.
To unsubscribe from this group and stop receiving emails from it, send an email to gremlin-user...@googlegroups.com.
To view this discussion on the web visit https://groups.google.com/d/msgid/gremlin-users/e937afbf-0ae7-43d2-ab8d-0c85e57f5d08%40googlegroups.com.

HadoopMarc
Op maandag 9 december 2019 13:38:20 UTC+1 schreef Stephen Mallette:
To unsubscribe from this group and stop receiving emails from it, send an email to gremli...@googlegroups.com.
Stephen Mallette
To unsubscribe from this group and stop receiving emails from it, send an email to gremlin-user...@googlegroups.com.
To view this discussion on the web visit https://groups.google.com/d/msgid/gremlin-users/24497442-606b-4171-9d23-b1c55c7aea1f%40googlegroups.com.

Benjamin Ross
To view this discussion on the web visit https://groups.google.com/d/msgid/gremlin-users/CAA-H43-dAWeAMnHDrJ-NYX4EWBVqqox%2Bb2%2BMm7J8_nGpjk16%2Bw%40mail.gmail.com.
Umesh Jayasinghe
- If you don't clear the graph and execute another gremlin query, results of previous query and new query will be merged and be shown. (build the visualization using multiple queries)
- Node and edge properties are shown once you click on a node/edge
- Change the labels of nodes to any property
- View the set of queries executed to generate the graph
- Traverse in/out from the selected node
To unsubscribe from this group and stop receiving emails from it, send an email to gremli...@googlegroups.com.
Stephen Mallette
To unsubscribe from this group and stop receiving emails from it, send an email to gremlin-user...@googlegroups.com.
To view this discussion on the web visit https://groups.google.com/d/msgid/gremlin-users/2a697517-044e-4537-89ea-d2bd37b4911f%40googlegroups.com.