How to create a image file from a graph through the gremlin console?
瀏覽次數:695 次
跳到第一則未讀訊息

Marlon
2018年1月5日 凌晨1:02:292018/1/5
收件者:Gremlin-users
For example, given this graph:
How to print and save the graph into a file for visualization? I want a PNG or JPG file.
I am new to this and thanks for help.

Stephen Mallette
2018年1月5日 清晨7:05:172018/1/5
收件者:Gremlin-users
Answered on SO:
--
You received this message because you are subscribed to the Google Groups "Gremlin-users" group.
To unsubscribe from this group and stop receiving emails from it, send an email to gremlin-users+unsubscribe@googlegroups.com.
To view this discussion on the web visit https://groups.google.com/d/msgid/gremlin-users/062b9edc-1439-4d75-b0d3-305a7b7c8cd7%40googlegroups.com.
For more options, visit https://groups.google.com/d/optout.

Kelvin Lawrence
2018年1月5日 上午11:51:042018/1/5
收件者:Gremlin-users
If you use Python at all, the networkx and matploitlib libraries can read a GraphML file and render it. I have used this in a Python Notebook with Gremlin Python running where I extracted a subgraph to GraphML and rendered it using Python.
The code would be along the lines of:
"import matplotlibimport matplotlib.pyplot as pltimport networkx as nx
G = nx.parse_graphml(mygraph)

label = nx.get_node_attributes(G, "code")
plt.figure(figsize=(11,11))
nx.draw(G, node_color="#ffaa00",node_size=1200,labels=label,arrows=False)
Apologies in advance if my Python is ugly I'm more of a Ruby and Groovy guy :-)
Cheers
Kelvin
On Friday, January 5, 2018 at 6:05:17 AM UTC-6, Stephen Mallette wrote:
Answered on SO:
On Fri, Jan 5, 2018 at 12:33 AM, Marlon <marl...@gmail.com> wrote:
For example, given this graph:gremlin> graph = TinkerFactory.createModern() (1) ==>tinkergraph[vertices:6 edges:6] gremlin> g = graph.traversal(standard()) (2) ==>graphtraversalsource[tinkergraph[vertices:6 edges:6], standard] gremlin> g.V().has('name','marko').out('knows').values('name') (3)How to print and save the graph into a file for visualization? I want a PNG or JPG file.I am new to this and thanks for help.
--
You received this message because you are subscribed to the Google Groups "Gremlin-users" group.
To unsubscribe from this group and stop receiving emails from it, send an email to gremlin-user...@googlegroups.com.
Marlon
2018年1月6日 下午4:38:422018/1/6
收件者:Gremlin-users
Hi, Stephen:
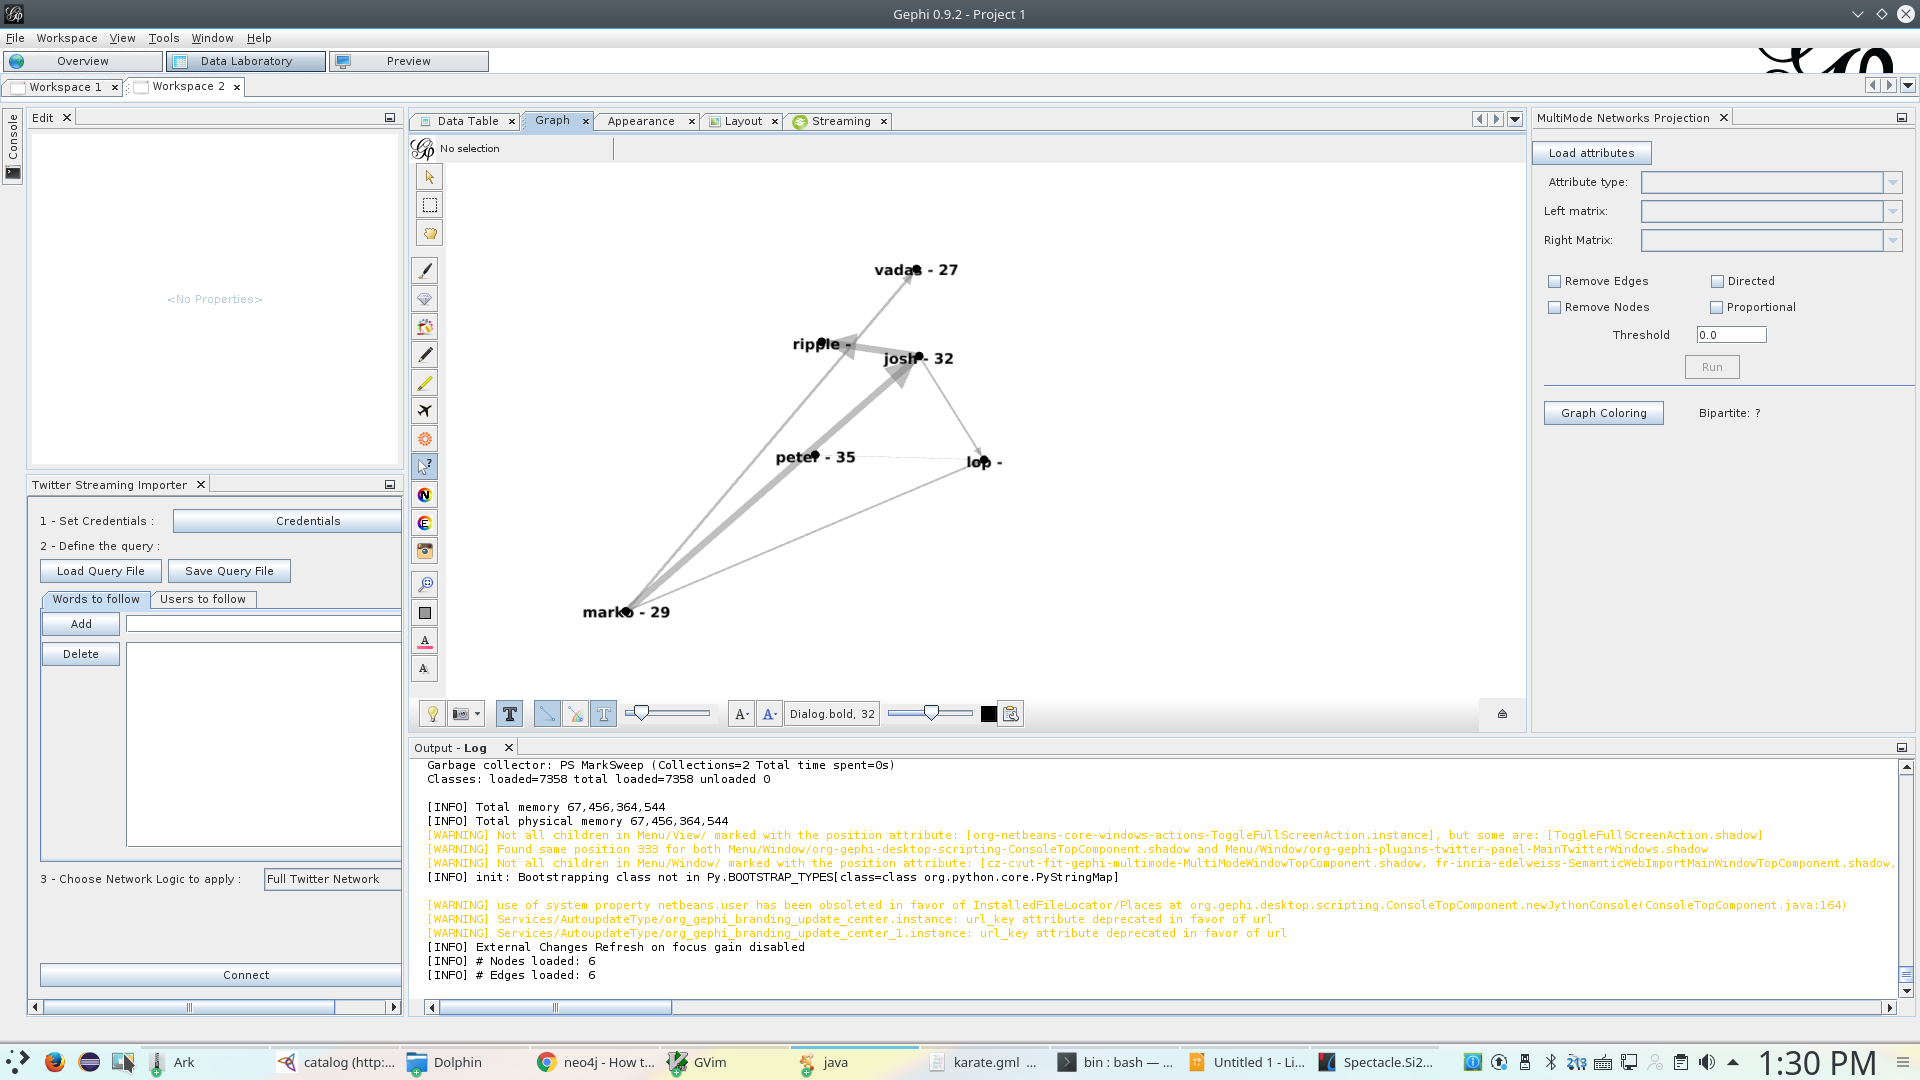
I it works. However, the default visualization looks very bad. I imported the "tinkerpop-classic.xml" from the TinkerPop gremlin's sample data directory and it looks very ugly. Please see the attached.
How difficult to make it looks like the "tinkerpop-modern.png" in the attachment.
Thanks.
On Friday, January 5, 2018 at 4:05:17 AM UTC-8, Stephen Mallette wrote:
Answered on SO:
On Fri, Jan 5, 2018 at 12:33 AM, Marlon <marl...@gmail.com> wrote:
For example, given this graph:gremlin> graph = TinkerFactory.createModern() (1) ==>tinkergraph[vertices:6 edges:6] gremlin> g = graph.traversal(standard()) (2) ==>graphtraversalsource[tinkergraph[vertices:6 edges:6], standard] gremlin> g.V().has('name','marko').out('knows').values('name') (3)How to print and save the graph into a file for visualization? I want a PNG or JPG file.I am new to this and thanks for help.
--
You received this message because you are subscribed to the Google Groups "Gremlin-users" group.
To unsubscribe from this group and stop receiving emails from it, send an email to gremlin-user...@googlegroups.com.
Stephen Mallette
2018年1月6日 下午5:47:202018/1/6
收件者:Gremlin-users
gephi is a visualization tool. you have to apply layouts (and sometimes configure those layouts) to get it to look nice. dig into the gephi documentation a bit to find answers on how to do that. The "nice" pic you see was done by hand in omnigraffle - no special magic there.
To unsubscribe from this group and stop receiving emails from it, send an email to gremlin-users+unsubscribe@googlegroups.com.
To view this discussion on the web visit https://groups.google.com/d/msgid/gremlin-users/8071f0f7-a68a-4c22-8450-17159180d965%40googlegroups.com.
Ling
2018年1月6日 下午6:58:502018/1/6
收件者:gremli...@googlegroups.com
Yes, I wanted to create a graph by hand for presentation. Gephi seems quite hard to use to make it look nice.
--
You received this message because you are subscribed to a topic in the Google Groups "Gremlin-users" group.
To unsubscribe from this topic, visit https://groups.google.com/d/topic/gremlin-users/g1UiOzrFE-M/unsubscribe.
To unsubscribe from this group and all its topics, send an email to gremlin-users+unsubscribe@googlegroups.com.
To view this discussion on the web visit https://groups.google.com/d/msgid/gremlin-users/CAA-H43_2psFX5CWvozXfgTgHw5RTyvLriefV1XqzG_QWBYU2ag%40mail.gmail.com.
Stephen Mallette
2018年1月6日 晚上7:33:392018/1/6
收件者:Gremlin-users
You can move all those vertices around manually if you like in gephi. You should be able to create presentation quality graphs with that tool.
To view this discussion on the web visit https://groups.google.com/d/msgid/gremlin-users/CA%2Bi%2BWxENzqFz%3DqjEPcpMna9NvcHgPSUsH1%3DmXLQr08i1a6NgjA%40mail.gmail.com.

Zeph
2018年1月18日 下午5:22:562018/1/18
收件者:Gremlin-users
Is there a way to do this on larger graphs?
To view this discussion on the web visit https://groups.google.com/d/msgid/gremlin-users/8071f0f7-a68a-4c22-8450-17159180d965%40googlegroups.com.
For more options, visit https://groups.google.com/d/optout.
--
You received this message because you are subscribed to a topic in the Google Groups "Gremlin-users" group.
To unsubscribe from this topic, visit https://groups.google.com/d/topic/gremlin-users/g1UiOzrFE-M/unsubscribe.
To unsubscribe from this group and all its topics, send an email to gremlin-user...@googlegroups.com.
To view this discussion on the web visit https://groups.google.com/d/msgid/gremlin-users/CAA-H43_2psFX5CWvozXfgTgHw5RTyvLriefV1XqzG_QWBYU2ag%40mail.gmail.com.
--
You received this message because you are subscribed to the Google Groups "Gremlin-users" group.
To unsubscribe from this group and stop receiving emails from it, send an email to gremlin-user...@googlegroups.com.
Stephen Mallette
2018年1月18日 下午5:28:552018/1/18
收件者:Gremlin-users
I guess it depends on what you mean by "large". With Gephi and just about any visualization tool that i know of, your ability to deal with "large" is constrained by how much memory you have. Aside from memory issues, larger graphs will also take a longer time to get layouts executed and sensible for interpretation and presentation. So - I think the answer is that you can visualize just about any graph of any size provided you have the memory and time to do it.
To unsubscribe from this group and stop receiving emails from it, send an email to gremlin-users+unsubscribe@googlegroups.com.
To view this discussion on the web visit https://groups.google.com/d/msgid/gremlin-users/8fe89d27-cb77-4e93-bd6e-64acb6e3f88d%40googlegroups.com.
Ashley E.
2018年1月18日 晚上7:49:512018/1/18
收件者:gremli...@googlegroups.com
Yes, I am definitely running out of memory with this command.
To view this discussion on the web visit https://groups.google.com/d/msgid/gremlin-users/CAA-H43_6_JWPg8KhKCPUCR%2B2q9Fs2iahHH0_qKg5LXKugT%3DCuQ%40mail.gmail.com.
Stephen Mallette
2018年1月19日 清晨7:07:512018/1/19
收件者:Gremlin-users
perhaps you've already done this but you can increase your -Xmx settings for Gephi to give it more memory if you have some available:
To unsubscribe from this group and all its topics, send an email to gremlin-users+unsubscribe@googlegroups.com.
To view this discussion on the web visit https://groups.google.com/d/msgid/gremlin-users/CAA-H43_6_JWPg8KhKCPUCR%2B2q9Fs2iahHH0_qKg5LXKugT%3DCuQ%40mail.gmail.com.
For more options, visit https://groups.google.com/d/optout.
--
You received this message because you are subscribed to the Google Groups "Gremlin-users" group.
To unsubscribe from this group and stop receiving emails from it, send an email to gremlin-users+unsubscribe@googlegroups.com.
To view this discussion on the web visit https://groups.google.com/d/msgid/gremlin-users/783F2362-3CD1-4CFE-A2D6-0D001CD2B7C5%40gmail.com.
回覆所有人
回覆作者
轉寄
0 則新訊息