How to set up animation in Paraview?
351 views
Skip to first unread message

Sony Achmad Louis
Aug 30, 2016, 11:21:58 PM8/30/16
to gprMax-users
Hello gprMax,
Thanks for guiding me recently,
I want to ask a question.
How to set up paraview to display #snapshot animation seems like example video on youtube?
I couldn't display EM wave propagation in animation (see picture).
I will be grateful if you give me guidance to solve it
Sony
Thanks for guiding me recently,
I want to ask a question.
How to set up paraview to display #snapshot animation seems like example video on youtube?
I couldn't display EM wave propagation in animation (see picture).
I will be grateful if you give me guidance to solve it
Sony


Craig Warren
Aug 31, 2016, 3:22:11 AM8/31/16
to gprMax-users
Hi Sony,
Have you followed the guidance in the documentation - http://docs.gprmax.com/en/latest/output.html#snapshots ?
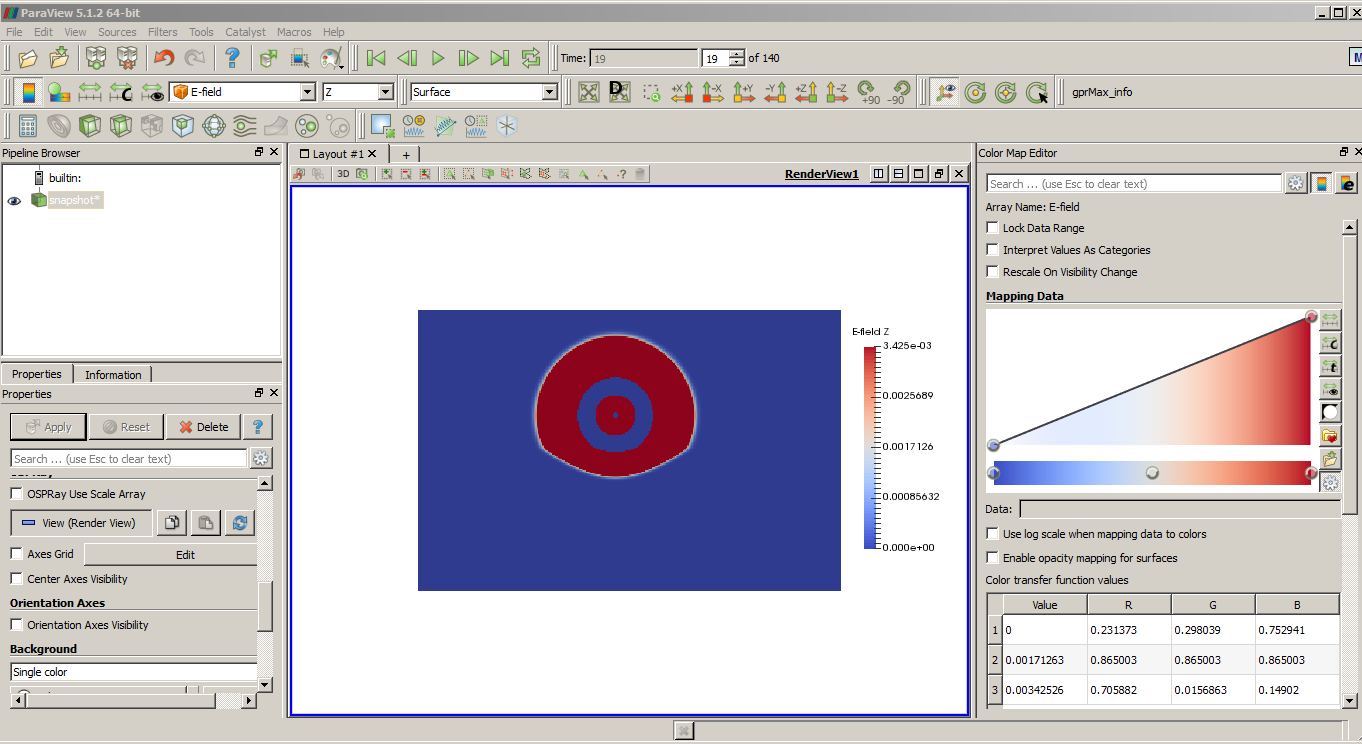
From your screenshot you seem to be trying to visualise the receivers (shows the location of receivers) from your geometry file. You need to select the snapshots in the Pipeline Browser and them choose the field you want to visualise.
Craig
Message has been deleted
Message has been deleted
Sony Achmad Louis
Aug 31, 2016, 5:18:14 AM8/31/16
to gprMax-users
Thank you for replying my message, Mr. Craig.
It's really helpful.
I tried to follow the guidance in the documentation.
I selected the snapshot as shown in picture 1, and choosed E-field -> Z -> Surface.
And I run the animation, but the geometry of object no displayed.
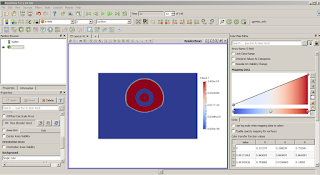
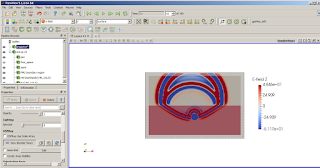
Then, I opened geometry file (.vti) of snapshot as shown in picture 2.
The visualization of #snapshot looks correct, but the scale of color legend is false when I compared to Ez data from matlab.
Any suggestion what supposed I do to solve it?
Because I have no much experience of using Paraview.
Sony
It's really helpful.
I tried to follow the guidance in the documentation.
I selected the snapshot as shown in picture 1, and choosed E-field -> Z -> Surface.
And I run the animation, but the geometry of object no displayed.
Then, I opened geometry file (.vti) of snapshot as shown in picture 2.
The visualization of #snapshot looks correct, but the scale of color legend is false when I compared to Ez data from matlab.

Any suggestion what supposed I do to solve it?
Because I have no much experience of using Paraview.
Sony
Craig Warren
Aug 31, 2016, 10:17:12 AM8/31/16
to gprMax-users
As you have realised the geometry file and the snapshots of the EM fields are separate. You can overlay them in Paraview as you have done in the 2nd image. You'll need to open the Color Map Editor (View menu) and experiment with the colour scaling to suit what you want to visualise in the snapshots. Have a look at the tips in the docs link from my previous message.
Paraview is a powerful visualiser for scientific data and there is lots of info on using it on the web.
Kind regards,
Craig
Reply all
Reply to author
Forward
0 new messages