no runtime error stacktraces showing up in devmode
118 views
Skip to first unread message

Chris
Jul 22, 2015, 5:14:22 PM7/22/15
to Google Web Toolkit
I'm running devmode through maven plugin (only mention because I'm not sure it is related) and I can't seem to get
Integer i = null;
i.intValue();
any stack traces of errors encountered from the client code.
When I run my GWT app, I don't see any third tab appearing like example here:
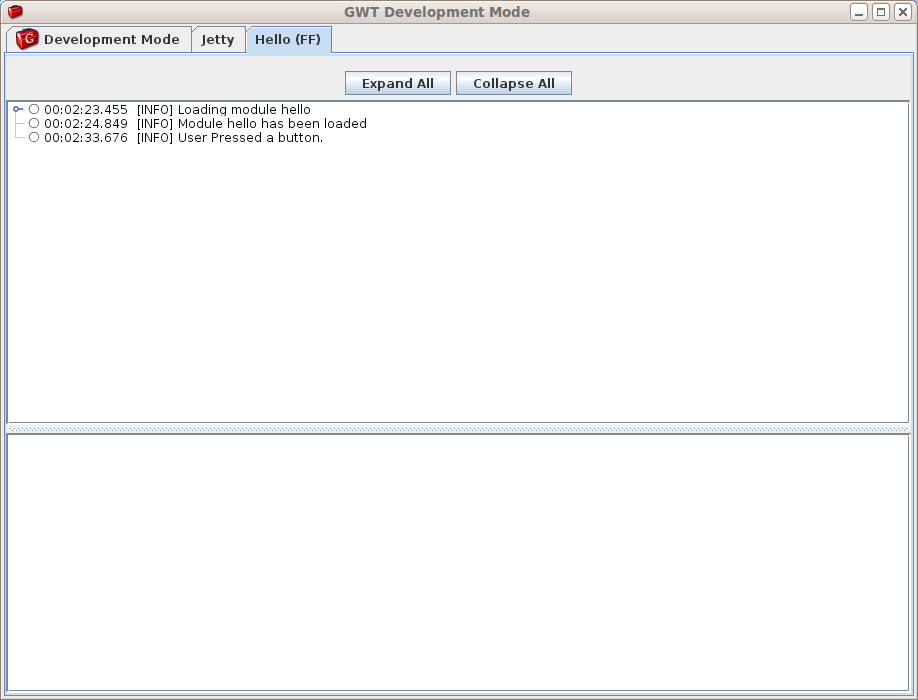
Source
(see it has a Hello (FF) tab).
Nor, any nice stack traces like this:

Source:
Everything is hidden or behind a javascript error, for example I put this in my code:
i.intValue();
Which should obviously generate a null pointer, but rather than a nice stack trace, I see this in the Chrome console but nothing in devmode window or on the terminal console.
[15:32:37.971] "Wed Jul 22 15:32:37 GMT-400 2015 com.google.gwt.logging.client.LogConfiguration
SEVERE: (TypeError) : i_0_g$ is nullcom.google.gwt.core.client.JavaScriptException: (TypeError) : i_0_g$ is null
at Unknown.onModuleLoad2_0_g$(http://127.0.0.1)
at Unknown.execute_64_g$(http://127.0.0.1)
at Unknown.doExecuteCommands_0_g$(http://127.0.0.1)
at Unknown.run_7_g$(http://127.0.0.1)
at Unknown.fire_0_g$(http://127.0.0.1)
at Unknown.createCallback_0_g$/<(http://127.0.0.1)
at Unknown.apply_0_g$(http://127.0.0.1)
at Unknown.entry0_0_g$(http://127.0.0.1)
at Unknown.entry_1_g$/<(http://127.0.0.1)
at Unknown.anonymous(Unknown)
"
Any idea what I'm doing wrong, why can't I see stack traces anymore. I'm using GWT 2.7 with chrome and would really appreciate any help. It is difficult to debug without nice stack traces!
Chris

Jens
Jul 22, 2015, 5:37:02 PM7/22/15
to Google Web Toolkit
You are not doing anything wrong, the website is a bit outdated. By default GWT 2.7 DevMode now uses the so called SuperDevMode (SDM). SDM compiles all your Java source to JavaScript and thats why you see JavaScript exceptions inside your Chrome console instead of Java exceptions inside the DevMode window.
The old, classic DevMode which actually executes your Java code as Java and thus produces Java exceptions is considered deprecated because it requires a browser plugin which does not work anymore in most recent browser versions.
So you should get used to the JavaScript exceptions. If you can, I would recommend using GWT 2.8 SNAPSHOT which has quite some logging fixes. With these fixes you should always have a link next to each exception stack frame in Chrome console which points to the corresponding Java file + line number. If you click on the link then Chrome will show you the Java file.
If you can not use GWT 2.8 SNAPSHOT then you could try using https://gist.github.com/jnehlmeier/cddbc476fd330b1d4999 to get links to Java files in JavaScript stack traces.
There is also an Eclipse plugin on Github called SDBG which allows you to connect from Eclipse to your Chrome browser. Then all Chrome console output is redirected to your Eclipse console and you can also set break points inside Eclipse which will be synced with the browser. IntelliJ 14 supports this out of the box.
-- J.
Chris
Jul 22, 2015, 6:32:20 PM7/22/15
to Google Web Toolkit, jens.ne...@gmail.com
Thanks, this is really helpful... I'm actually using IntelliJ 14, but even when I setup with IntelliJ, I'm not getting any stack traces... Do I need to be using GWT 2.8 SNAPSHOT with IntelliJ too? When I run it with IntelliJ, I'm not getting any stack traces either, at least with GWT 2.7.
Chris
Chris
Jul 22, 2015, 7:02:24 PM7/22/15
to Google Web Toolkit, jens.ne...@gmail.com, chris...@gmail.com
Thank you... So this did the trick...
public void onModuleLoad() {
GWT.setUncaughtExceptionHandler(new SuperDevModeUncaughtExceptionHandler());
GWT.setUncaughtExceptionHandler(new SuperDevModeUncaughtExceptionHandler());
I still don't see the exceptions in IntelliJ, but least I'm getting class/line number of errors found in the Javascript console, which is much more helpful than the JS errors.
Thanks again.
Chris
Reply all
Reply to author
Forward
0 new messages