Embedded charts no longer displaying correctly
200 views
Skip to first unread message

William Green
Jun 27, 2017, 10:29:03 AM6/27/17
to Google Visualization API
Hi folks,
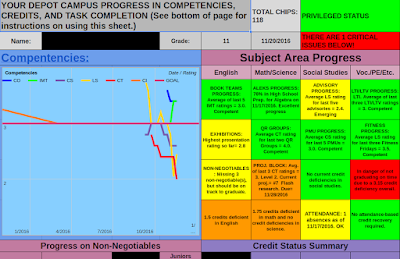

I have been using a Google Apps script to create charts to track student progress and they stopped working a couple of weeks ago. It appears that the colors of the background and series are being overridden in the Google Sheet when the chart is created, so that I lose all of the formatting I created with the script. if I edit the chart from the spreadsheet, I can change the color of the series and background and everything is fine--the data is there. Is this a conflict with the new Sheets Chart editor? How can I fix this problem?
Here is my script:
function onOpen() {
var ss = SpreadsheetApp.getActiveSpreadsheet();
var pasteSheet = [ {name: "Paste Spreadsheet", functionName: "copyChanges"}];
ss.addMenu("Copy to Spreadsheets", pasteSheet);
var ss = SpreadsheetApp.getActiveSpreadsheet();
var sheet = ss.getSheets()[0];
var charts = sheet.getCharts();
for (var i in charts) {
sheet.removeChart(charts[i]);
}
var sheet = SpreadsheetApp.getActiveSheet()
var chart = sheet.newChart();
var spr = SpreadsheetApp.getActiveSpreadsheet();
var cellNum = spr.getRange("e128");
var ct = 0;
while (cellNum.offset(ct, 0).getValue() != "" ) {
ct++;
}
// return ct;
var lastRow = ct + 128;
var chartRange = sheet.getRange(121, 1, ct, 8);
chart.addRange(chartRange)
.setChartType(Charts.ChartType.LINE)
.setPosition(4, 1, 5, 5)
.setOption('title', 'Competencies')
.setOption('legend', 'bottom')
.setOption('width', 540)
.setOption('height', 460)
.setOption('vAxis.title', 'Rating')
.setOption('hAxis.title', 'Date')
.setOption('backgroundColor.fill','87CFFF')
.setOption('hAxis.slantedText','true')
.setOption('series',{'0':{'color':'0000ff'},'1':{'color':'00ff00'}, '2':{'color':'775baf'},'3':{'color':'ffd700'},'4':{'color':'ff1a33'},'5':{'color':'fc7b11'}})
.setOption('annotations.stem.color','none')
.setOption('chartArea', {width: '100%', height: '100%'})
.setOption('legend', {position: 'in'})
.setOption('titlePosition', 'in')
.setOption('axisTitlesPosition','in')
.setOption('hAxis.textPosition','in')
.setOption('vAxis.textPosition','in')
.setOption('vAxis.viewWindow.max','4')
.setOption('vAxis.viewWindow.min','1')
.setOption('lineWidth',5);
sheet.insertChart(chart.build());
I have it erase the existing chart and build a new one each time the sheet is opened so that it will also build a new chart when I create new sheets for new stduents.
Below is the old output (before June, 2017) and the new output, with the formatting lost.

Thanks for your help!
Sincerely,
Bill

Daniel LaLiberte
Jun 27, 2017, 10:32:42 AM6/27/17
to Google Visualization API
This could be a bug in the latest version of Google Charts, used internally by AppsScript. Or the bug could be elsewhere. I'll be looking into it. Thanks for your report.
--
You received this message because you are subscribed to the Google Groups "Google Visualization API" group.
To unsubscribe from this group and stop receiving emails from it, send an email to google-visualization-api+unsub...@googlegroups.com.
To post to this group, send email to google-visualization-api@googlegroups.com.
Visit this group at https://groups.google.com/group/google-visualization-api.
To view this discussion on the web visit https://groups.google.com/d/msgid/google-visualization-api/3354e3e5-1272-4e8b-9882-b233c1fbbe12%40googlegroups.com.
For more options, visit https://groups.google.com/d/optout.
Reply all
Reply to author
Forward
0 new messages