Material Line Charts
175 views
Skip to first unread message

TubeDH
Oct 12, 2017, 9:40:45 AM10/12/17
to Google Visualization API
Hello,
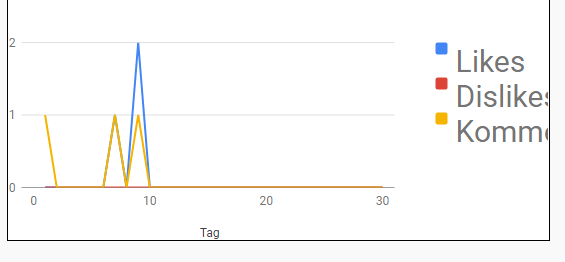
i have make a Material Line Charts and the legend is cut. You can't see the full legend only a part. Here the Picture and the code:

The second Picture ist form https://google-developers.appspot.com/chart/interactive/docs/gallery/linechart
google.charts.load('current', {'packages':['line']});google.charts.setOnLoadCallback(drawChart);
function drawChart() {
  var data = new google.visualization.DataTable();  data.addColumn('number', 'Tag');  data.addColumn('number', 'Likes');  data.addColumn('number', 'Dislikes');  data.addColumn('number', 'Kommentare');


  data.addRows([    [1, 0, 0, 1], [2, 0, 0, 0], [3, 0, 0, 0], [4, 0, 0, 0], [5, 0, 0, 0], [6, 0, 0, 0], [7, 1, 0, 1], [8, 0, 0, 0], [9, 2, 0, 1], [10, 0, 0, 0],
    [11, 0, 0, 0], [12, 0, 0, 0], [13, 0, 0, 0], [14, 0, 0, 0], [15, 0, 0, 0], [16, 0, 0, 0], [17, 0, 0, 0], [18, 0, 0, 0], [19, 0, 0, 0], [20, 0, 0, 0],   [21, 0, 0, 0], [22, 0, 0, 0], [23, 0, 0, 0], [24, 0, 0, 0], [25, 0, 0, 0], [26, 0, 0, 0], [27, 0, 0, 0], [28, 0, 0, 0],
    [29, 0, 0, 0], [30, 0, 0, 0]
]);
  var options = {    title: 'Diesen Monat',    width: 540,    height: 260  };


  var chart = new google.charts.Line(document.getElementById('comments_likes_dislikes'));  chart.draw(data, google.charts.Line.convertOptions(options));}
rocky
Oct 27, 2017, 5:01:29 AM10/27/17
to Google Visualization API
Try something like :
draw(data, {
                width: 500, height: 400,
                chartArea: {width: '50%'}}
        );
TubeDH
Oct 29, 2017, 11:59:56 AM10/29/17
to Google Visualization API
It's don't do anything
Reply all
Reply to author
Forward
0 new messages