Geo-Chart Help
174 views
Skip to first unread message

Methexis
Oct 31, 2011, 1:11:35 PM10/31/11
to Google Visualization API
Hi Guys,
I am relatively new to the world of Google API's, I am having
trouble getting a Geo-Chart to work, I am not sure if some of the
Countries and not being excepted or the range of numbers I am using is
too big? Or maybe I have just made a silly mistake in the code
somewhere! If you could provide me with any pointers then that would
be great (see code below)
<html>
<head>
<script type='text/javascript' src='https://www.google.com/jsapi'></
script>
<script type='text/javascript'>
google.load('visualization', '1', {'packages': ['geochart']});
google.setOnLoadCallback(drawRegionsMap);
function drawRegionsMap() {
var data = new google.visualization.DataTable();
data.addRows(80);
data.setValue(0, 0,'Germany');
data.setValue(0, 1, 0.00103848347381885);
data.setValue(1, 0,'Norway');
data.setValue(1, 1, 0.00180973991416224);
data.setValue(2, 0,'Cuba');
data.setValue(2, 1, 0.00210557965018684);
data.setValue(3, 0,'Austria');
data.setValue(3, 1, 0.0082075052891974);
data.setValue(4, 0,'Elsalvador');
data.setValue(4, 1, 0.00846859464395429);
data.setValue(5, 0,'Bermuda');
data.setValue(5, 1, 0.00850960851522224);
data.setValue(6, 0,'Mauritius');
data.setValue(6, 1, 0.00905978766915257);
data.setValue(7, 0,'Puertorico');
data.setValue(7, 1, 0.0109507174044958);
data.setValue(8, 0,'Costarica');
data.setValue(8, 1, 0.0117682915139483);
data.setValue(9, 0,'Cambodia');
data.setValue(9, 1, 0.0125562089231326);
data.setValue(10, 0,'Guatemala');
data.setValue(10, 1, 0.0149901817297706);
data.setValue(11, 0,'Philippines');
data.setValue(11, 1, 0.0235846777510385);
data.setValue(12, 0,'Syrianarab republic');
data.setValue(12, 1, 0.0388724661176721);
data.setValue(13, 0,'Mongolia');
data.setValue(13, 1, 0.0443523933654036);
data.setValue(14, 0,'Trinidad and Tobago');
data.setValue(14, 1, 0.0464138472111849);
data.setValue(15, 0,'Lebanon');
data.setValue(15, 1, 0.0542708950244222);
data.setValue(16, 0,'Japan');
data.setValue(16, 1, 0.0599986005895139);
data.setValue(17, 0,'Bahamas');
data.setValue(17, 1, 0.0679967006298871);
data.setValue(18, 0,'Italy');
data.setValue(18, 1, 0.0743754402083856);
data.setValue(19, 0,'Indonesia');
data.setValue(19, 1, 0.0810338863954557);
data.setValue(20, 0,'Pakistan');
data.setValue(20, 1, 0.0930510872227923);
data.setValue(21, 0,'Jordan');
data.setValue(21, 1, 0.109967026624616);
data.setValue(22, 0,'Afghanistan');
data.setValue(22, 1, 0.112511474752534);
data.setValue(23, 0,'New Zealand');
data.setValue(23, 1, 0.115991988255670);
data.setValue(24, 0,'China');
data.setValue(24, 1, 0.120717453736984);
data.setValue(25, 0,'Ethiopia');
data.setValue(25, 1, 0.134005401542951);
data.setValue(26, 0,'Azerbaijan');
data.setValue(26, 1, 0.139611627863642);
data.setValue(27, 0,'Romania');
data.setValue(27, 1, 0.169179131377017);
data.setValue(28, 0,'Southafrica');
data.setValue(28, 1, 0.170303377593613);
data.setValue(29, 0,'Yemen');
data.setValue(29, 1, 0.175764085624121);
data.setValue(30, 0,'Poland');
data.setValue(30, 1, 0.200804628142514);
data.setValue(31, 0,'Netherlands');
data.setValue(31, 1, 0.228111375063224);
data.setValue(32, 0,'Malaysia');
data.setValue(32, 1, 0.244323911160968);
data.setValue(33, 0,'Morocco');
data.setValue(33, 1, 0.283963494107767);
data.setValue(34, 0,'Venezuela');
data.setValue(34, 1, 0.336317520203695);
data.setValue(35, 0,'Panama');
data.setValue(35, 1, 0.336742472604199);
data.setValue(36, 0,'France');
data.setValue(36, 1, 0.336979149444891);
data.setValue(37, 0,'Turkmenistan');
data.setValue(37, 1, 0.349120946141466);
data.setValue(38, 0,'Ecuador');
data.setValue(38, 1, 0.359446728256400);
data.setValue(39, 0,'Singapore');
data.setValue(39, 1, 0.370636510810656);
data.setValue(40, 0,'Mexico');
data.setValue(40, 1, 0.382947933154108);
data.setValue(41, 0,'Dominican Republic');
data.setValue(41, 1, 0.408002739304901);
data.setValue(42, 0,'Egypt');
data.setValue(42, 1, 0.409984532855393);
data.setValue(43, 0,'Vietnam');
data.setValue(43, 1, 0.415435156103793);
data.setValue(44, 0,'Israel');
data.setValue(44, 1, 0.466677490321647);
data.setValue(45, 0,'Oman');
data.setValue(45, 1, 0.474277513442783);
data.setValue(46, 0,'Portugal');
data.setValue(46, 1, 0.492446538261351);
data.setValue(47, 0,'Argentina');
data.setValue(47, 1, 0.529532302505806);
data.setValue(48, 0,'Korea republic of');
data.setValue(48, 1, 0.60671652226831);
data.setValue(49, 0,'Greece');
data.setValue(49, 1, 0.609350999665561);
data.setValue(50, 0,'Chile');
data.setValue(50, 1, 0.630522949734734);
data.setValue(51, 0,'Iraq');
data.setValue(51, 1, 0.655122622313295);
data.setValue(52, 0,'Sweden');
data.setValue(52, 1, 0.6553306250384);
data.setValue(53, 0,'Bahrain');
data.setValue(53, 1, 0.738730759479933);
data.setValue(54, 0,'La opeople's democratic republic');
data.setValue(54, 1, 0.783101001979252);
data.setValue(55, 0,'Peru');
data.setValue(55, 1, 0.870699414664552);
data.setValue(56, 0,'United Kingdom');
data.setValue(56, 1, 0.921282671816578);
data.setValue(57, 0,'Hong Kong');
data.setValue(57, 1, 0.92229152453654);
data.setValue(58, 0,'Taiwan province of China');
data.setValue(58, 1, 0.922465558276313);
data.setValue(59, 0,'Canada');
data.setValue(59, 1, 0.96063898130338);
data.setValue(60, 0,'Nigeria');
data.setValue(60, 1, 0.988087251283347);
data.setValue(61, 0,'Spain');
data.setValue(61, 1, 1.04694418671797);
data.setValue(62, 0,'Colombia');
data.setValue(62, 1, 1.08617592447722);
data.setValue(63, 0,'Turkey');
data.setValue(63, 1, 1.24856262909833);
data.setValue(64, 0,'Slovakia (slovakrepublic)');
data.setValue(64, 1, 1.30088241834603);
data.setValue(65, 0,'Libyan arab jamahiriya');
data.setValue(65, 1, 1.31976611613652);
data.setValue(66, 0,'Qatar');
data.setValue(66, 1, 1.37754800231897);
data.setValue(67, 0,'India');
data.setValue(67, 1, 1.80016458417967);
data.setValue(68, 0,'Angola');
data.setValue(68, 1, 1.84952534351454);
data.setValue(69, 0,'Kuwait');
data.setValue(69, 1, 2.58691047577597);
data.setValue(70, 0,'Papua New Guinea');
data.setValue(70, 1, 2.66804430086685);
data.setValue(71, 0,'Russian federation');
data.setValue(71, 1, 2.91377657455782);
data.setValue(72, 0,'Algeria');
data.setValue(72, 1, 3.6599275689124);
data.setValue(73, 0,'Brazil');
data.setValue(73, 1, 4.54444592729183);
data.setValue(74, 0,'Kazakhstan');
data.setValue(74, 1, 5.12004823413248);
data.setValue(75, 0,'Thailand');
data.setValue(75, 1, 5.63241898008293);
data.setValue(76, 0,'United Arab Emirates');
data.setValue(76, 1, 7.62391190607786);
data.setValue(77, 0,'United States');
data.setValue(77, 1, 8.42191904404764);
data.setValue(78, 0,'Australia');
data.setValue(78, 1, 8.83016613695258);
data.setValue(79, 0,'Saudiarabia');
data.setValue(79, 1, 10);
var options = {};
var container = document.getElementById('map_canvas');
var geochart = new google.visualization.GeoChart(container);
geochart.draw(data, options);
};
</script>
</head>
<body>
<div id='map_canvas'></div>
</body>
</html>
Thanks again!

asgallant
Oct 31, 2011, 3:40:45 PM10/31/11
to google-visua...@googlegroups.com
You didn't define any columns in the DataTable. It looks like you want two columns, add this right after you declare the DataTable:
data.addColumn('string', 'Country');
data.addColumn('number', 'Value');
Methexis
Oct 31, 2011, 6:34:59 PM10/31/11
to google-visua...@googlegroups.com
I noticed that as soon as I posted, tried it and it still didnt work! Does the generator in the back ground disregard country names it does not understand or would that cause ti to fail?!
Did you have any luck getting it working by just adding the column headers and types in?
Thanks Again!
Did you have any luck getting it working by just adding the column headers and types in?
Thanks Again!
asgallant
Nov 1, 2011, 8:39:06 AM11/1/11
to google-visua...@googlegroups.com
Row 55 has an unescaped apostraphe in the string - you either need to escape it or use double quotes around the string. Here is a working version of your code: http://jsfiddle.net/23kCS/
Methexis
Nov 1, 2011, 9:03:03 AM11/1/11
to google-visua...@googlegroups.com
asgallant,
Thanks for getting back to me on this, I spent some more time looking at this and found the main problem I was coming across were the way the countries had been named in the source data so I have now used the 2 letter code and this seems to have solved all of my problems!
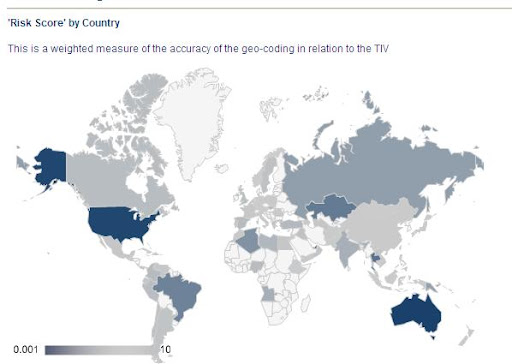
Although now the gradient slider in the bottom left hand corner is the wrong way round compared to the results being displayed on the map, any ideas?
asgallant
Nov 1, 2011, 9:31:03 AM11/1/11
to google-visua...@googlegroups.com
You need to supply the 'colors' option with the color for the lowest value first and the color for the highest value second, ie: http://jsfiddle.net/23kCS/1/
Assuming the data set is basically the same (aside from the change to country codes), your screen cap definitely looks backwards, though. Not sure why that is; can you post the code that produced that chart?
Reply all
Reply to author
Forward
0 new messages