Google Visualization Limits Width?
1,244 views
Skip to first unread message

Trevor Haba
Jul 8, 2013, 10:03:20 AM7/8/13
to google-visua...@googlegroups.com
Hello
I am attempting to dynamically generate <div> tags to be filled with google visualizations. So far I have everything working except for one bug which is currently rendering my program useless. The width of the divs wont change! So I am stuck with really narrow graphs that are impossible to read. Here is my code:
var thisDashboard = document.createElement(chartDivID);
thisDashboard.setAttribute("id", chartDivID);
thisDashboard.setAttribute("style", "width: 100%; height: 425 px;");
document.getElementById("chartArea").appendChild(thisDashboard);
var thisChart = document.createElement(chartDivID + "_chart");
thisChart.setAttribute("id", chartDivID + "_chart");
thisChart.setAttribute("style", "width: 100%; height: 300px;");
thisDashboard.appendChild(thisChart);
var thisControl = document.createElement(chartDivID + "_scrollBar");
thisControl.setAttribute("id", chartDivID + "_scrollBar");
thisControl.setAttribute("style", "width: 100%; height: 75 px;");
thisDashboard.appendChild(thisControl);
var dashboard = new google.visualization.Dashboard(document.getElementById(chartDivID));
var control = new google.visualization.ControlWrapper({
'controlType': 'ChartRangeFilter',
'containerId': chartDivID + '_scrollBar',
'options': {
// Filter by the date axis.
'filterColumnIndex': 0,
'ui': {
'chartType': 'LineChart',
'chartOptions': {
'chartArea': {'width': '1000px', 'height': '65%'},
'hAxis': {'baselineColor': 'none'}
},
}
}
});
var chart = new google.visualization.ChartWrapper({
'chartType': 'LineChart',
'containerId': chartDivID + '_chart',
'options': {
// Use the same chart area width as the control for axis alignment.
'chartArea': {'height': '80%', 'width': '1000px'},
'hAxis': {'slantedText': true}
}
});
dashboard.bind(control, chart);
dashboard.draw(logging_data_table);
Everything is in order as far as I can tell. But when I load the website, here is what I get:
<dashboard0 id="dashboard0" style="width:100%; positiion: relative;">
<dashboard0_chart id="dashboard0_chart" style="width: 100% ...">
<div dir="ltr" style="width 400px;" ....>
... within here is more google visualiation data ......
So clearly google's visualization is inherently limiting the size of the chart. How can I stop it from doing this? I wasn't having this problem when I was rendering just one chart on the page, but now I have several. Does the visualization API run into problems with more than one chart on the page? If so, how can I get around this?
Thanks for your help!

asgallant
Jul 8, 2013, 12:53:41 PM7/8/13
to google-visua...@googlegroups.com
There are a few things here:
1) If you don't specify a "width" and "height" parameter for the chart, the API takes the width and height of the container div as the dimensions of the chart.
2) you are specifying the chartArea.height and chartArea.width, which only affect the internal region of the chart (where the lines are drawn, not including the title, legend, axis labels). This value can never be larger than the defined (in the height/width options) or derived (from the container div's dimensions) height and width of the chart.
3) you are specifying the chartArea.width as a string, when it should be a number, eg:
chartArea: {
height: '80%', // percents should be strings
width: 1000 // pixel dimensions should be numbers
}
If you intend for the dimensions you are setting in your chartArea to be the dimensions of the chart, just pull them out from the chartArea option and use them on their own.
If you want to align the control and the chart, you need to specify *both* the width and the chartArea.width options to make it work.
Trevor Haba
Jul 9, 2013, 4:34:18 AM7/9/13
to google-visua...@googlegroups.com
I tried the things you mentioned but I am not seeing the problems. For example I do want the divs for the charts to take up 100% of the screen width. But even changing them all to 1000 pixel width doesn't help. Looking at it in the debugger I am still seeing the same thing. The outer div region is 1000px or 100% and the ltr is only 400 pixels wide. I can make it smaller by shrinking the outer divs, but it wont expand to fill them.
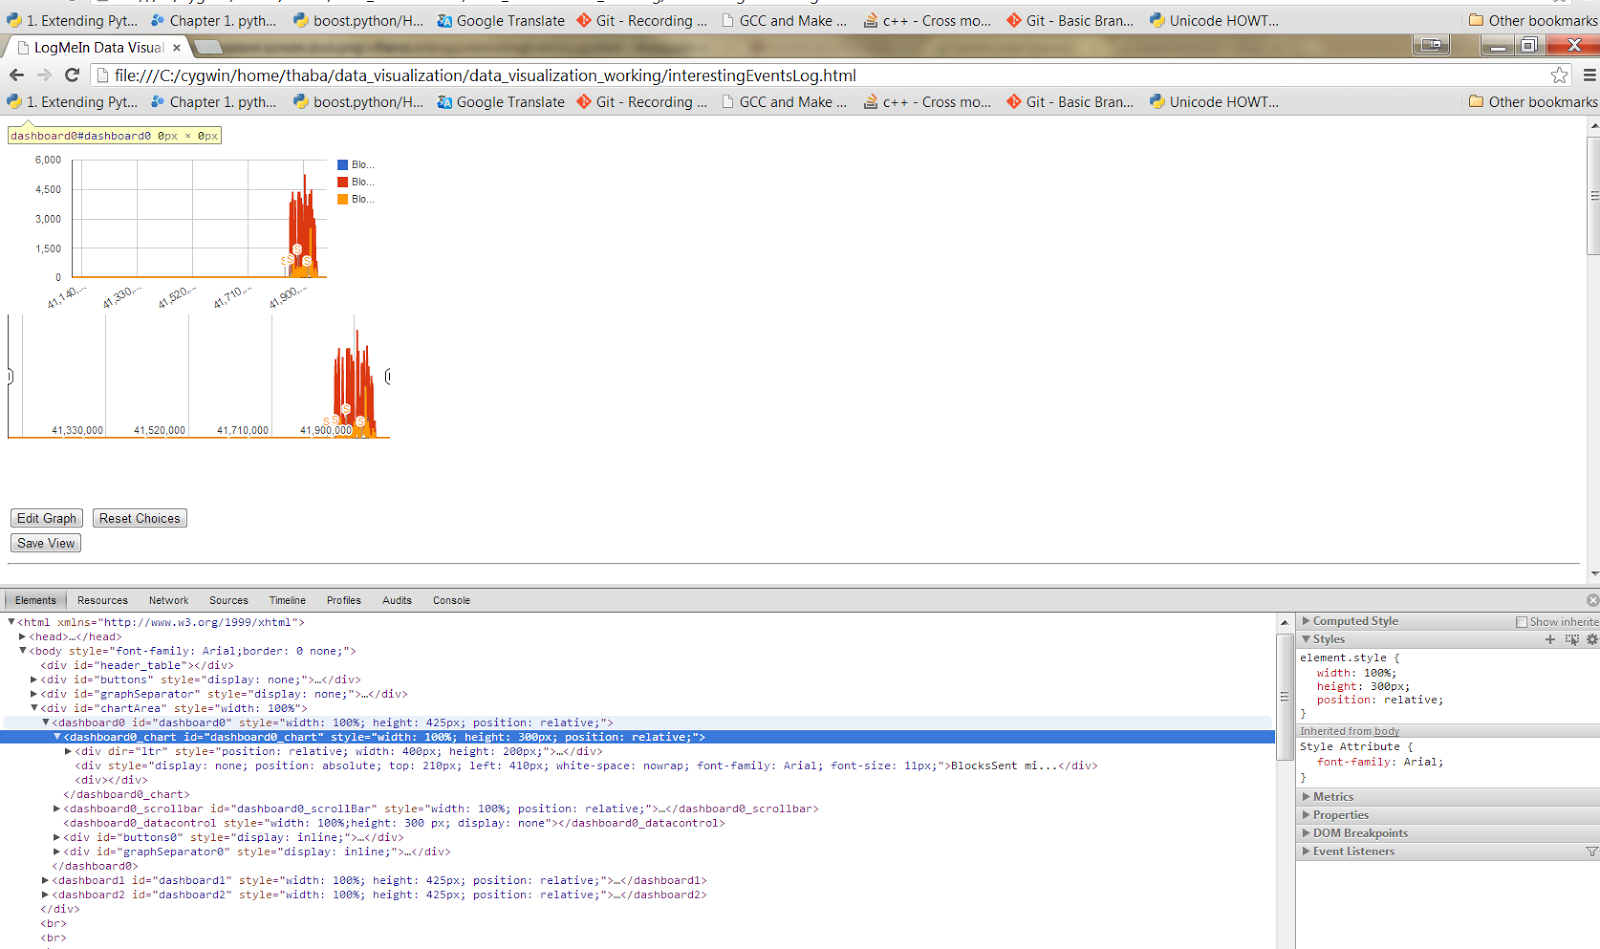
I have included what I hope to be an enlightening screen shot. The highlighted value in the element tree is the parent of the actual chart image. You can see, all the way up the chain of divs, they are all set to 100%. It is just the "ltr" div which has a restricted size. I am curious why when I hover over the dashboard0_chart outer region it shows a size 0 x 0. When I hover over other elements it show the height and width of them correctly. But that value cannot be 0 x 0, as it has a height and width value in the style of the element. So what could be the problem?
The code remains as before.
Thanks!
Message has been deleted
Trevor Haba
Jul 9, 2013, 4:48:39 AM7/9/13
to google-visua...@googlegroups.com
oops, forgot the picture. Here it is:
asgallant
Jul 9, 2013, 12:22:11 PM7/9/13
to google-visua...@googlegroups.com
I can't duplicate the problem. Can you post your full code or a link to the page?

Oliver Hyde
Jul 21, 2013, 6:07:53 PM7/21/13
to google-visua...@googlegroups.com
Hey Trevor,
Did you end up finding a solution to this problem? I am having the same issue.
Cheers,
Oly
asgallant
Jul 21, 2013, 7:15:43 PM7/21/13
to google-visua...@googlegroups.com
If you post your code or a link to the site so I can see the problem first hand, I can help you figure it out.
Oliver Hyde
Jul 21, 2013, 8:27:22 PM7/21/13
to google-visua...@googlegroups.com
For me my issue is trying to set the width of the graph to 100%. I'm doing this using a bootstrap tabbing system with different graphs on different tabs. The 100% works on the first tab, but falls to shit on the others.
I have narrowed the issue down to being that when the graph is instantiated within a div that has a display: none value it uses some default width/height that google has set. I'm just wanting to override this setting.
In this case, GraphOne and GraphTwo and initialised in the javascript with a width of '100%'
I have narrowed the issue down to being that when the graph is instantiated within a div that has a display: none value it uses some default width/height that google has set. I'm just wanting to override this setting.
So for example:
<div class="tabbable">
<ul class="nav nav-tabs">
<li class="active"><a data-toggle="tab" href="#tab1">Graph One</a></li>
<li><a data-toggle="tab" href="#tab2">Graph Two</a></li>
</ul>
<div class="tab-content">
<div class="tab-pane active" id="tab1">
<div id="GraphOne" class="UsageGraph"></div>
</div>
<div class="tab-pane" id="tab2">
<div id="GraphTwo" class="UsageGraph"></div>
</div>
</div>
</div>
Let me know if I can provide anymore relevant information.
Cheers,
Oly
asgallant
Jul 21, 2013, 11:17:34 PM7/21/13
to google-visua...@googlegroups.com
There is a problem with dimensions in hidden divs that requires all charts to be drawn in visible divs. You can either draw the charts on page load and instantiate the tabs after the charts finish drawing, or you can hook event listeners into your tab structure to draw the charts in a tab only when the tab is first opened.
Reply all
Reply to author
Forward
0 new messages