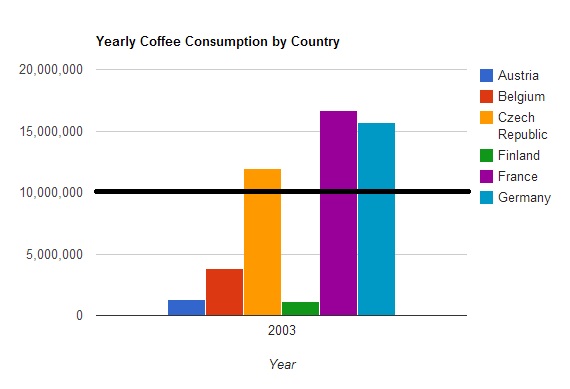
Add a 'Target Line' at Column Chart
14,233 views
Skip to first unread message

Zoro Swordsman
Apr 23, 2013, 2:15:25 AM4/23/13
to google-visua...@googlegroups.com

asgallant
Apr 23, 2013, 12:00:51 PM4/23/13
to google-visua...@googlegroups.com
You have to switch to a ComboChart. Use the "series" option to set your data series to "bars" type and add a "line" series with the value of 10000000 at each point.
Zoro Swordsman
Apr 23, 2013, 6:25:28 PM4/23/13
to google-visua...@googlegroups.com
But if I use ComboChart then how I suppose to make the 'line' draw from 0 until the end? I mean based on the minimum and maximum value of x-axis exactly same like the diagram shown.. Thanks..
asgallant
Apr 23, 2013, 7:00:45 PM4/23/13
to google-visua...@googlegroups.com
Is your "year" axis based on strings or numbers?
Zoro Swordsman
Apr 23, 2013, 8:38:34 PM4/23/13
to google-visua...@googlegroups.com
Actually my data is not like shown in the figure. My y-axis value should be 'Percentage' while x-axis while be 'Departments. So the value of x-axis is 'string'. So,how I suppose to write the code for that single straight line? Can some me an example of source code? Thanks.
On Tuesday, April 23, 2013 2:15:25 PM UTC+8, Zoro Swordsman wrote:
On Tuesday, April 23, 2013 2:15:25 PM UTC+8, Zoro Swordsman wrote:
asgallant
Apr 23, 2013, 9:21:34 PM4/23/13
to google-visua...@googlegroups.com
With a string-type axis, you cannot get an edge-to-edge line like that, unfortunately.
Zoro Swordsman
Apr 23, 2013, 10:30:57 PM4/23/13
to google-visua...@googlegroups.com
Okay.. Thank.. Highly appreciate your help..
On Tuesday, April 23, 2013 2:15:25 PM UTC+8, Zoro Swordsman wrote:
On Tuesday, April 23, 2013 2:15:25 PM UTC+8, Zoro Swordsman wrote:
Reply all
Reply to author
Forward
0 new messages