How to add trend lines on the chart.
516 views
Skip to first unread message

Li-Ming Lu
Sep 1, 2011, 5:25:04 PM9/1/11
to google-visua...@googlegroups.com
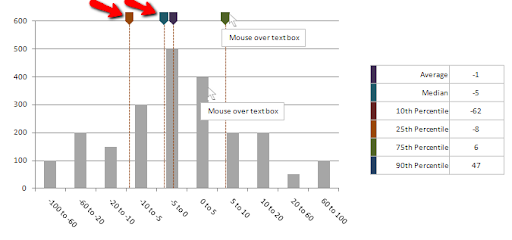
Trend lines are horizontal/vertical lines spanning the chart canvas which aid in interpretation of data with respect to some pre-determined value. For example, if you are plotting sales data of current year, you might want to add previous year's average monthly sales as trend indicator for ease of comparison.
How to add image to the end of trend line?

Viz Kid
Sep 5, 2011, 6:31:36 AM9/5/11
to google-visua...@googlegroups.com
Hope this helps,
Viz Kid
--
You received this message because you are subscribed to the Google Groups "Google Visualization API" group.
To view this discussion on the web visit https://groups.google.com/d/msg/google-visualization-api/-/ayW9sjozqhgJ.
To post to this group, send email to google-visua...@googlegroups.com.
To unsubscribe from this group, send email to google-visualizati...@googlegroups.com.
For more options, visit this group at http://groups.google.com/group/google-visualization-api?hl=en.
Reply all
Reply to author
Forward
0 new messages