Region GeoChart and custom text
27 views
Skip to first unread message

Sunil Ferro
Jan 15, 2021, 9:51:57 AM1/15/21
to Google Visualization API
Hi,
Can Region GeoChart be displayed for different states of different countries and can custom text be displayed on the Region GeoChart? I am using the Google Region GeoChart to implement chart similar to Excel Map Chart.
1. The requirement is to display states of more than one country on the Region GeoChart. Tried to use region property set to world but this does not seem to work.
function drawRegionsMap() {
var objChart = [
['State', 'Popularity'],
['Maharashtra', 200],
['Goa', 300],
['Kerala', 400],
['Alabama', 500],
['Colorado', 600],
['Idaho', 700]
];
var data = google.visualization.arrayToDataTable(objChart);
var options = {
region: 'world',
displayMode: 'regions',
resolution: 'provinces',
colorAxis: { colors: ['#e7711c', '#4374e0'] }
};
var chart = new google.visualization.GeoChart(document.getElementById('dvMapChartContainer'));
chart.draw(data, options);
}
2. Is it possible to display text, like shown below, on the Region GeoChart? If yes, then is there a way this can be done?
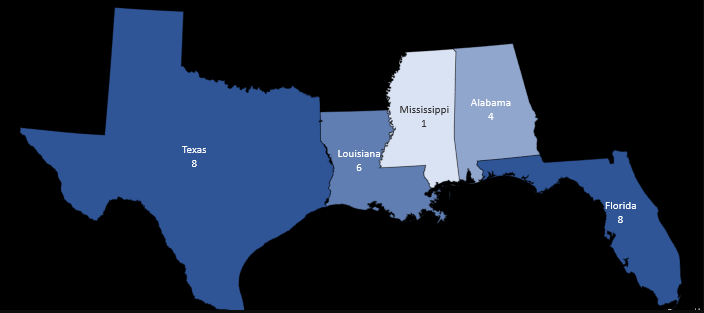
Thank you.
Reply all
Reply to author
Forward
0 new messages