Gauge Accuracy
93 views
Skip to first unread message

Bob Lonseth
Apr 11, 2022, 12:04:19 PM4/11/22
to Google Visualization API
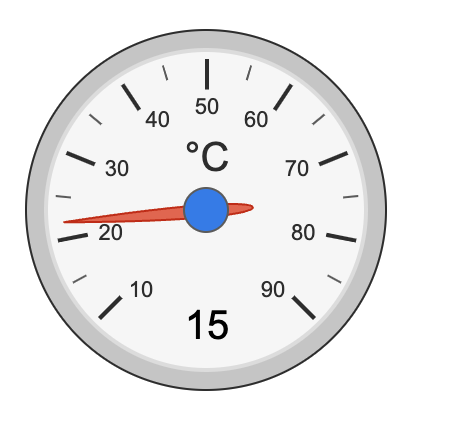
I'm new to Google Charts so not sure if this is a real issue. I am implementing some gauge controls in a web site and the needle is pointing to incorrect values. They are close, but not close enough for me. I would appreciate any suggestions to make the control point to the correct value. The gauge should show 15 in the example below...
Code:
google.charts.load('current', {'packages':['gauge']});
google.charts.setOnLoadCallback(drawChart);
function drawChart()
{
data = google.visualization.arrayToDataTable([
['Label', 'Value'],
["°C", 15],
]);
options = {
width: 200, height: 200,
min: 0,
max: 100,
majorTicks: ["10", "20", "30", "40", "50", "60", "70", "80", "90"],
minorTicks: 2
};
var chart = new google.visualization.Gauge(document.getElementById("gauge-div"));
chart.draw(data, options);
}
Output:
Thanks!
Bob Lonseth
Apr 11, 2022, 12:54:30 PM4/11/22
to Google Visualization API
Figured it out.
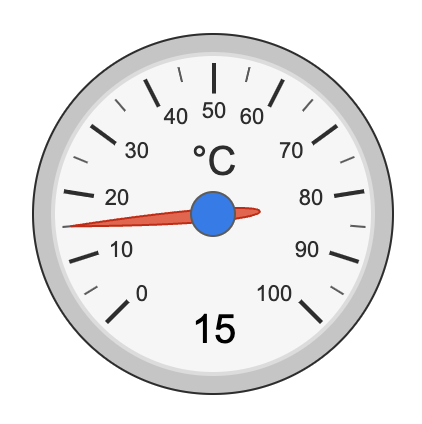
Make sure the majorTicks option contains the min and max values.
majorTicks: ["0", "10", "20", "30", "40", "50", "60", "70", "80", "90", "100"],
Reply all
Reply to author
Forward
0 new messages