Changing hAxis values range in a Line chart
29 views
Skip to first unread message

Sérgio Santos
Mar 1, 2016, 7:07:16 AM3/1/16
to Google Visualization API
Hi all,
rate612182430
I am trying to set up a line chart by pulling data fro a database.
this is the data that I'm parsing to do the line graph:
[25,1.426899858638629],[26,1.4305538040158847],[27,1.4212216486789044],[28,1.434596757546949],[29,1.4250494942867946],[30,1.440278818318682],[31,1.4244405447427937],[1,1.424055093424773],[2,1.4295517091942245],[3,1.4385591305613867],[4,1.4421482669558547],[5,1.4580022627987217],[6,1.4556888702708726],[7,1.4501580182541056],[8,1.4504105092157416],[9,1.4506208182893634],[10,1.4403825631559743],[11,1.447617949748277],[12,1.4523694821253164],[13,1.4479532787559413],[14,1.4504525159930712],[15,1.4504946506079428],[16,1.45258048549001],[17,1.4415453042977293],[18,1.4275517254289323],[19,1.4279390722064689],[20,1.433404044288428],[21,1.4406938873614636],[22,1.4404447677635754],[23,1.4274702246919986],[24,1.4096419545450307],[25,1.3983080498733729],[26,1.3936504782559433],[27,1.3974091500010328],[28,1.3868663292004801],[29,1.3865971985758159],[1,1.3876361285607601]
And this is how the graph display.
The bold numbers above should display in that order in the hAxis values range. In the Graph where it reads 6-12-18-24-30 (sequence 1 to 31) I would like to display a sequence that reflected my data, like, starting in 25-28-31-1-3-5-8-14-25-29-1-and so on.
Any way to do this?
Thanks in advanced
rate612182430
Sérgio Santos
Mar 1, 2016, 7:17:00 AM3/1/16
to Google Visualization API
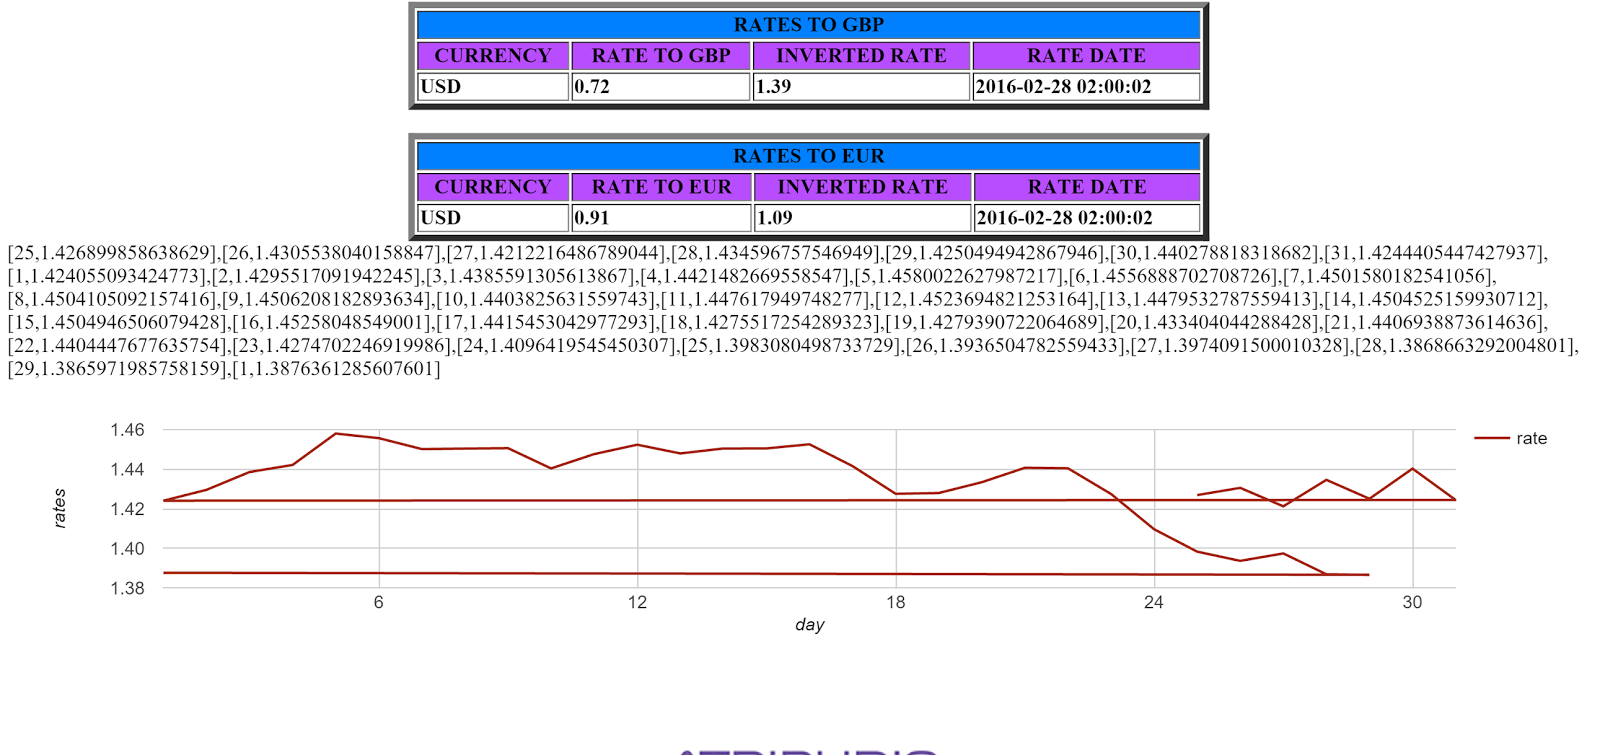
Image added to better understanding

Daniel LaLiberte
Mar 1, 2016, 10:21:11 AM3/1/16
to Google Visualization API
Hi Sérgio,
The LineChart does not sort the rows for you, so it will draw lines from one point to the next. You have to arrange that they are given in the order you want them to appear.
The LineChart does not sort the rows for you, so it will draw lines from one point to the next. You have to arrange that they are given in the order you want them to appear.
If you want to draw lines between those numeric values that are not in numeric order, just make them be strings instead by quoting them. However, these values look like days of the month, and if so, it might be better to use type 'date', and provide the values as dates.
--
You received this message because you are subscribed to the Google Groups "Google Visualization API" group.
To unsubscribe from this group and stop receiving emails from it, send an email to google-visualizati...@googlegroups.com.
To post to this group, send email to google-visua...@googlegroups.com.
Visit this group at https://groups.google.com/group/google-visualization-api.
To view this discussion on the web visit https://groups.google.com/d/msgid/google-visualization-api/6660a4b8-c0c8-4c5d-aab7-cddceedf54df%40googlegroups.com.
Sérgio Santos
Mar 1, 2016, 10:54:59 AM3/1/16
to Google Visualization API
Hi Daniel,
I tried to use 'string' and 'date' but the graph doesn't work.
here is the jsfiddle link
what am I doing wrong?
Thanks for your help
Daniel LaLiberte
Mar 1, 2016, 11:02:08 AM3/1/16
to Google Visualization API
Your values have to be the right type, corresponding to the type you declare. I fixed it for you in https://jsfiddle.net/syL57y45/
--
You received this message because you are subscribed to the Google Groups "Google Visualization API" group.
To unsubscribe from this group and stop receiving emails from it, send an email to google-visualizati...@googlegroups.com.
To post to this group, send email to google-visua...@googlegroups.com.
Visit this group at https://groups.google.com/group/google-visualization-api.
To view this discussion on the web visit https://groups.google.com/d/msgid/google-visualization-api/1a751d7f-46c0-4ef6-be91-38c110ffb1b7%40googlegroups.com.
Daniel LaLiberte
Mar 1, 2016, 11:07:44 AM3/1/16
to Google Visualization API
I couldn't figure out how to update that jsfiddle, actually. Not sure how it works in the collaboration mode. Here is the fixed version though: https://jsfiddle.net/dlaliberte/syL57y45/1/
Note that I used a DataView instead of changing all the values.
Sérgio Santos
Mar 1, 2016, 11:50:39 AM3/1/16
to Google Visualization API
Daniel, thank you very much for your help. It worked just fine.
so this mean if I want to manipulate the data type I will have to use dataView function?
Daniel LaLiberte
Mar 1, 2016, 12:00:15 PM3/1/16
to Google Visualization API
You don't have to use the DataView, but then your DataTable values have to match the type you specify for each column.
On Tue, Mar 1, 2016 at 11:50 AM, Sérgio Santos <sergi...@gmail.com> wrote:
Daniel, thank you very much for your help. It worked just fine.so this mean if I want to manipulate the data type I will have to use dataView function?
--
You received this message because you are subscribed to the Google Groups "Google Visualization API" group.
To unsubscribe from this group and stop receiving emails from it, send an email to google-visualizati...@googlegroups.com.
To post to this group, send email to google-visua...@googlegroups.com.
Visit this group at https://groups.google.com/group/google-visualization-api.
To view this discussion on the web visit https://groups.google.com/d/msgid/google-visualization-api/26908c3c-b15e-4272-9d34-b7cb2c0821ed%40googlegroups.com.
Reply all
Reply to author
Forward
0 new messages