Spreadsheet: Switch axis in google.visualization.Query() object
658 views
Skip to first unread message

Németh Attila
Apr 17, 2014, 5:13:04 AM4/17/14
to google-visua...@googlegroups.com
Hi,
I use Google Spreadsheet as data source in my visualisation reports. The riport contains 40+ charts so it would be necessary to limit and optimize Querys. I use some charts which use the same data with different axis. Now use two different Querys to create these charts.
It is possibe to swich axis in google.visualization.Query() object? It would dramatically decrease number of Querys.
Thanks.

Andrew Gallant
Apr 17, 2014, 9:29:55 AM4/17/14
to google-visua...@googlegroups.com
If by "switch axes" you mean choose which columns of data to use for each chart, then yes, you can do that, but not in the Query. Use DataViews to select columns from the DataTable:
// create a DataView based on the DataTable "data"
var view = new google.visualization.DataView(data);
// tell the view to use columns 3, 4, and 8 from data
view.setColumns([3, 4, 8]);
Then when you draw the chart, use view instead of data:
var chart = new google.visualization.LineChart(document.querySelector('#myChartDiv'));
chart.draw(view, {/* options */});
If you are using ChartWrapper objects, you can specify the view as a part of the object instead of creating discrete DataViews:
var chart = new google.visualization.ChartWrapper({
chartType: 'LineChart',
containerId: 'myChartDiv',
dataTable: data,
options: {/* options */},
view: {
// use columns 7, 0, 2, and 5 for this chart
columns: [7, 0, 2, 5]
}
});
Németh Attila
Apr 17, 2014, 11:05:30 AM4/17/14
to google-visua...@googlegroups.com
Thank you for your quick reply. Probably I didn't describe my problem correctly.
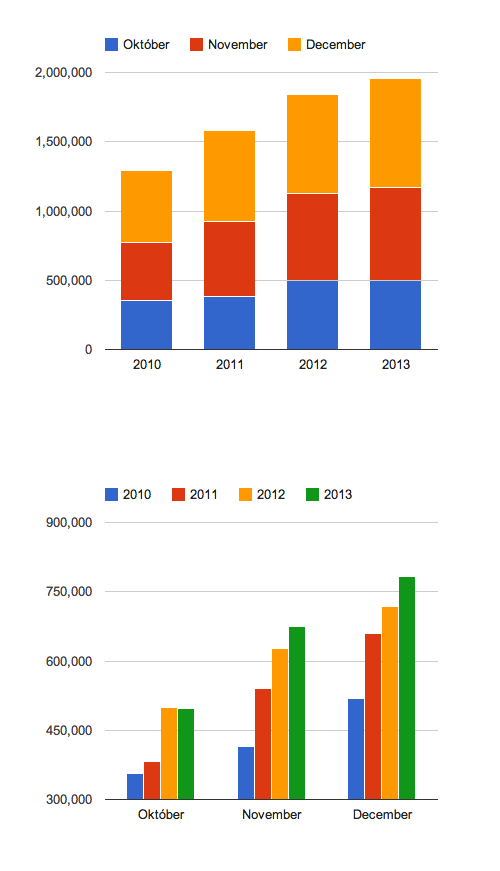
As I wrote I use google Spreadseet as data source. I have to visualize some data in different ways (stacked columns, etc.) by flipping header rows in data source (see attached pic). Now I can do this only if I double the data source area in Spreadsheet with TRANSPOSE function. Than I Query for two different area from the spreadsheet. This means two different Query and one unnecessary Transpose function in Spreadseet. It would be so much better to Query values once and than transpose data matrix in Javascript.
As I wrote I use google Spreadseet as data source. I have to visualize some data in different ways (stacked columns, etc.) by flipping header rows in data source (see attached pic). Now I can do this only if I double the data source area in Spreadsheet with TRANSPOSE function. Than I Query for two different area from the spreadsheet. This means two different Query and one unnecessary Transpose function in Spreadseet. It would be so much better to Query values once and than transpose data matrix in Javascript.
What do you think it is possible?
Andrew Gallant
Apr 17, 2014, 2:05:20 PM4/17/14
to google-visua...@googlegroups.com
You can manually transpose the data in javascript. Here's a basic script that assumes your first column is a "string" type (which contains the labels you want to use for your data series) and all others are type "number", and transposes the rows and columns:
// rawData is the base DataTable from the query
var newData = new google.visualization.DataTable();
newData.addColumn('string', 'domain data label'); // change this label to whatever is appropriate for you
for (var i = 0; i < rawData.getNumberOfRows(); i++) {
newData.addColumn('number', rawData.getValue(i, 0));
}
for (var i = 1; i < rawData.getNumberOfColumns(); i++) {
var row = [rawData.getColumnLabel(i)];
for (var j = 0; j < rawData.getNumberOfRows(); j++) {
row.push(rawData.getValue(j, i));
}
newData.addRow(row);
Németh Attila
Apr 18, 2014, 7:25:50 AM4/18/14
to google-visua...@googlegroups.com
Thank you for your answer it works great. Only a small issue remained: when the DataTable transposed values are loosing their format. It is possible to keep, or add formatting to values by a pattern? {pattern:'# ### ###'}
Andrew Gallant
Apr 18, 2014, 9:20:26 AM4/18/14
to google-visua...@googlegroups.com
You can push the formatted value of each data point to the new table as well, by changing this line:
row.push(rawData.getValue(j, i));
to this:
row.push({v: rawData.getValue(j, i), f: rawData.getFormattedValue(j, i)});
row.push(rawData.getValue(j, i));
to this:
row.push({v: rawData.getValue(j, i), f: rawData.getFormattedValue(j, i)});

Jakob Sjøbakken Fleiner
Sep 26, 2015, 12:46:35 PM9/26/15
to Google Visualization API
Hi,
I cant get this to work. How would one apply this to the following code? Wold much appreciate the help.
 google.setOnLoadCallback(drawChart);
      function drawChart() {        var queryString = encodeURIComponent('SELECT A, B, C, D, E');
      var query = new google.visualization.Query(          'https://docs.google.com/spreadsheets/d/1NHUlSqEo3LHiglHDr3W8KnhdHQdVqQ2sY5XJc9S77D8/gviz/tq?gid=1949000055&headers=1&tq=' + queryString);      query.send(handleQueryResponse);
    function handleQueryResponse(response) {      if (response.isError()) {        alert('Error in query: ' + response.getMessage() + ' ' + response.getDetailedMessage());        return;      }
        var options = {          title: 'Personer',          curveType: 'function',          hAxis: {            title: "Week"          },          vAxis: {               title: "Hours",               viewWindowMode:'explicit',              viewWindow:{                min:0              }            },          legend: { position: 'top' }        };
        var data = response.getDataTable();
        var chart = new google.visualization.LineChart(document.getElementById('curve_chart'));
        chart.draw(data, options);
      }    }
Reply all
Reply to author
Forward
0 new messages