Dual y-axis generates 2 x-axis
766 views
Skip to first unread message

Erez V.
May 11, 2019, 11:21:44 AM5/11/19
to Google Visualization API
Hello,
I created a dual y-axis
Ireceived a chart with dual y-axis but with 2 separate x axes.
Here is the code:
 google.charts.load('current', {'packages':['corechart']});
      google.charts.setOnLoadCallback(drawVisualization);


 ////////////////////////    Drawing the graph    //////////////////////
      function drawVisualization() {

        var data = new google.visualization.DataTable();
 data.addColumn('string', 'Couple');
 data.addColumn('number', 'profit');
 data.addColumn('number','trades');

 for(var i = 0; i < datum_b.length; i++){
 datum_b[i].profit=parseFloat(datum_b[i].profit);
 datum_c[i].trades=parseFloat(datum_c[i].trades);
 var obj_b = datum_b[i];
 var obj_c = datum_c[i];
 data.addRow([obj_b.item, obj_b.profit, obj_c.trades]);
 }

     var Options = {

   series: {
            0: {targetAxisIndex: 0},
            1: {targetAxisIndex: 1}
          },
          title:'Profit / Loss (left) and trades count (right) of all traded couples',
          vAxes: {

            0: {title: 'Profit', textStyle: {color: 'DodgerBlue', bold: true}},
            1: {title: 'Trades', textStyle: {color: 'Tomato', bold: true}}
          },


   hAxis: {title: 'Traded Couples ', direction: 1,
                  slantedText: true,
                  slantedTextAngle: 45
      }


        };


    var chart = new google.visualization.ColumnChart(document.getElementById('chart_div'));
    chart.draw(data, Options);
  }//END CHART 1
Here is a print screen of the result:
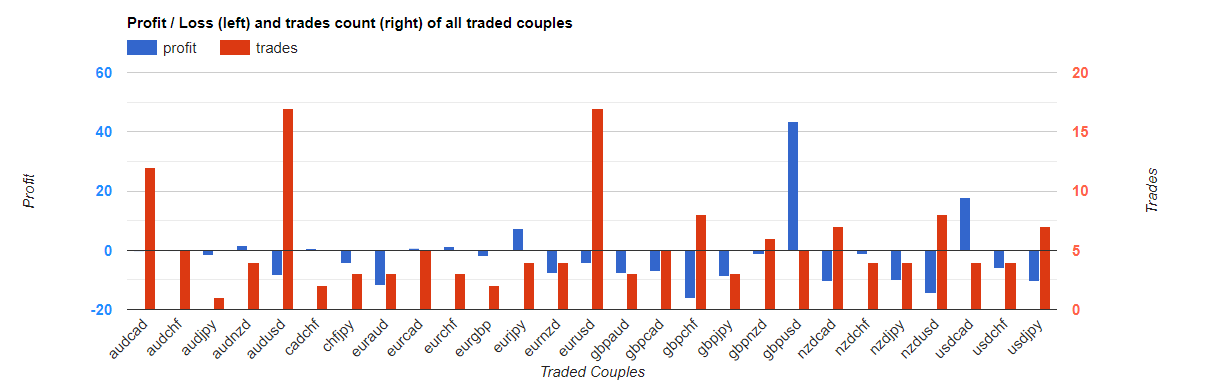
how do I change it to a single 0 x-axis
Can I change the title of the y-axes color to the legend color?
Thanks
Erez V.
May 18, 2019, 4:46:27 AM5/18/19
to Google Visualization API
Problem after following similar example of dual y axis in google documantation
I copied a working example in google documentation and replaced the relevant code to my chart. I got an error :
Data column(s) for axis #0 cannot be of type string
HHere is the code
Here is the code:
Here is the code:
$items_b = get_balance_of_all_couples();
$items_c = count_trades_of_all_couples();


foreach($items_b as $key => $val_b){
 $data[$key][0] = $val_b['item'];

 $data[$key][1] = (float)$val_b['profit'];
}


foreach($items_c as $key => $val_c){
 $data[$key][2] = (float)$val_c['trades'];
}


 $data[0] = array('item', 'profit', 'trades');


// website with solution


///https://blog.programster.org/php-converting-data-for-google-charts


?><html>
  <head>
    <script type="text/javascript" src="https://www.gstatic.com/charts/loader.js"></script>
    <script src="https://ajax.googleapis.com/ajax/libs/jquery/3.2.0/jquery.min.js"></script>
    <script type="text/javascript">


 ////////       Convert PhP $data array to JavaScript array    //////////

   var datum = <?php echo json_encode($data); ?>;
      google.charts.load("current", {packages:['corechart']});
      google.charts.setOnLoadCallback(drawVisualization);


 ////////////////////////    Drawing the graph    //////////////////////
      function drawVisualization() {
 var data = google.visualization.arrayToDataTable([datum]);

 var Options = {
          title:'Profit / Loss (left) and trades count (right) of all traded couples',

          series: {
   0: {targetAxisIndex: 0},
   1: {targetAxisIndex: 1}
                   },

          vAxes: {
   0: {title: 'Profit', textStyle: {color: 'DodgerBlue', bold: true}},
   1: {title: 'Trades', textStyle: {color: 'Tomato', bold: true}}
                 },


   hAxis: {   title: 'Traded Couples',
   slantedText: true,
   slantedTextAngle: 45
      },
        };

    var chart = new google.visualization.ColumnChart(document.getElementById('chart_div'));
    chart.draw(data, Options);
  }//END CHART
Pat Ng
Jul 31, 2021, 11:44:15 PM7/31/21
to Google Visualization API
The codes below works for dual-y scatter (left and right y-scales). What I want to do is dual-y and dual-x (input 2 x series and 2 y series like this
/* var data = new google.visualization.arrayToDataTable([
['Depth_m', 'Depth_ft', 'TempC', 'TempF'],
[2500, 8202, 0, 32],
[3250, 10663, 150, 302],
[3750, 12303, 180, 356],
[4000, 13123, 220, 428],
[4250, 13944, 350, 662]
]); */
Observation - it seems series 0 and 1 refer to respective y values.
Q: is there a way to take 2 x-series into Google chart for x-axis labels at the top and bottom accordingly?
Thanks.
// codes for dual-y scatter chart
<html>
<head>
<script type="text/javascript" src="https://www.gstatic.com/charts/loader.js"></script>
<script type="text/javascript">
google.charts.load("current", {packages: ["scatter"]});
google.charts.setOnLoadCallback(drawStuff);
function drawStuff() {
var data = new google.visualization.arrayToDataTable([
['TempC', 'Depth_m', 'Depth_ft'],
[0, 2500, 8202],
[150, 3250, 10663],
[180, 3750, 12303],
[220, 4000, 13123],
[350, 4250, 13944]
]);
var options = {
width: 800,
chart: {
title: 'Temperature vs Depth',
subtitle: 'Metric unit on the left, Imperial on the right'
},
series: {
0: { axis: 'Depth_m'}, // refer to y-values
1: { axis: 'Depth_ft'}
//2: { axis: 'TempC' },
//3: { axis: 'TempF' }
},
axes: {
x: {
Depth_m: {label: 'meter'},
Depth_ft: {label: 'feet'},
}
/* y: {
TempC: {label: 'Celsius'} // Bottom x-axis.
//TempF: {label: 'Fahrenheit'} // Top x-axis.
} */
}
};
var chart = new google.charts.Scatter(document.getElementById('dual_x_div'));
chart.draw(data, options);
};
</script>
</head>
<body>
<div id="dual_x_div" style="width: 900px; height: 500px;"></div>
</body>
</html>
Reply all
Reply to author
Forward
0 new messages