Google charts and wordpress HELP
32 views
Skip to first unread message

Marshall Hawley
Dec 8, 2015, 12:34:00 PM12/8/15
to Google Visualization API
I need help customizing my chart in my wordpress website.
I really know nothing about putting shortcodes together or how to customize different items.
Situation:
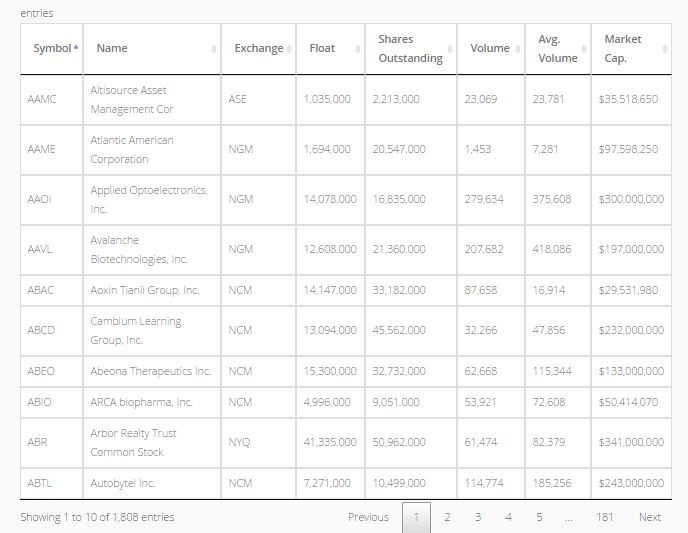
I am using the wordpress plugin 'Inline Google Spreadsheet viewer' and do not know how to edit different aspects of my table. My chart looks like that below attached image.
I am looking to change the font size of the cells, the color of the cells or of a row of cell, the row height/column width, number of rows per page, and MAYBE add filters above the chart if possible.
How do I go about doing all this and where to put the shortcodes/html codes?
(I also have two charts on my and would like them to match aside from the number of rows.)
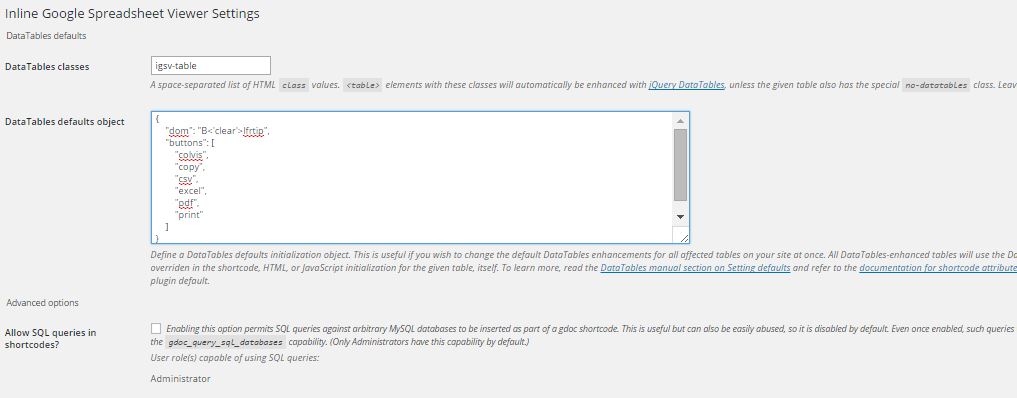
This is all i see in my wordpress dashboard:
Reply all
Reply to author
Forward
0 new messages