help! Unwilling date on columns chart and repeated date labels.
22 views
Skip to first unread message

Gonzalo V
Dec 10, 2020, 10:48:13 AM12/10/20
to Google Visualization API
Hi everyone
I need some help and/or orientation. I have spent a lot time trying to fix those issues without success (stuckoverflow, general google, etc).
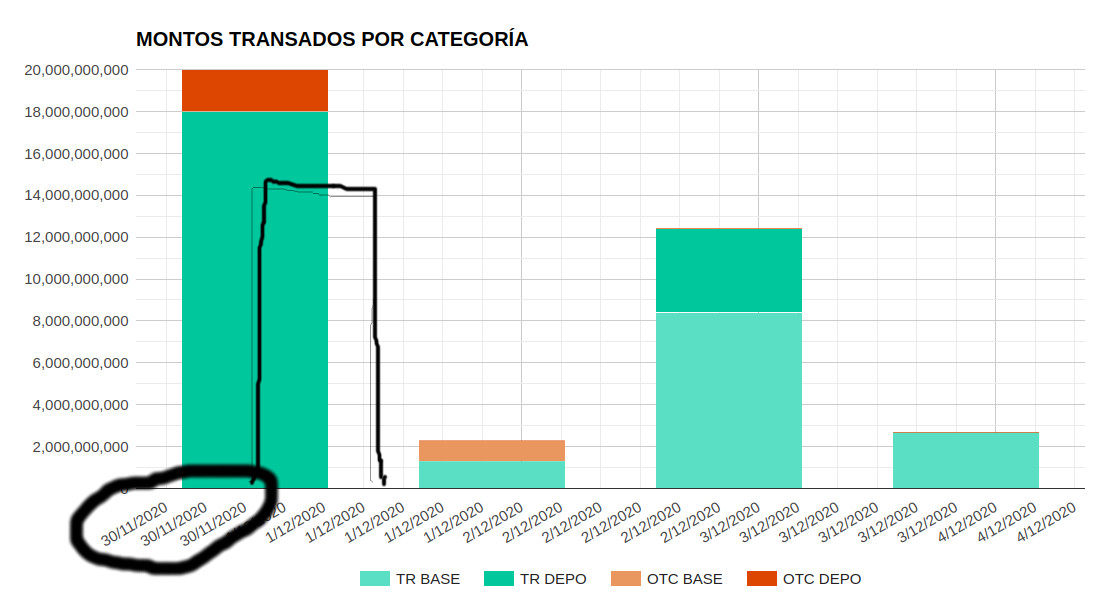
There are 4 columns, each one for each day and the days are 2020-12-01,2020-12-02, 2020-12-03, 2020-12-01, but on the chart appear 2020-31-11 (marked into a black circle), I dont want this date and i cant understand the logic why is setting there. I cant remove repeated date labels and i tried some solutions and the columns are not centered. I think there are something on the googlechart logic that i do not undestanding and thats why i praying for your help. Sorry my english and greetings from Chile.
function SerieMontos() {
var data = google.visualization.arrayToDataTable([
['Fecha', 'TR BASE', 'TR DEPO', 'OTC BASE', 'OTC DEPO'],
[new Date('2020-12-01') , 0,18000000000,0,2000000000],
[new Date('2020-12-02') , 1300000000,0,1000000000,0],
[new Date('2020-12-03') , 8400000000,4000000000,0,0],
[new Date('2020-12-04') , 2670000000,0,0,0],
]);
var vista = new google.visualization.DataView(data);
vista.setColumns([{
calc:function(dt,row){
console.log(parseInt(dt.getValue(row,0)));
return parseInt(dt.getValue(row,0));
},
label: data.getColumnLabel(0),
type:'number'},
1,2,3,4
]);
var options = {
title: 'MONTOS TRANSADOS POR CATEGORÍA',
titleTextStyle:{
fontSize: 20,
},
legend: { position: 'bottom' },
width: '100%',
height: 600,
isStacked: 'true',
hAxis:{
format:'d/MM/YYYY',
slantedText:'true',
ticks:vista.getDistinctValues(0),
},
colors:['#76D7C4','#1ABC9C','#E59866','#D35400'],
chartArea:{
left:'10%',top:'10%',width:'80%',height:'70%',
},
};
var chart = new google.visualization.ColumnChart(document.getElementById('Serie_Montos_div'));
chart.draw(vista, options);
}
Reply all
Reply to author
Forward
0 new messages