Google Charts 'upcoming' release of v49
260 views
Skip to first unread message

Daniel LaLiberte
Jul 8, 2020, 6:49:56 PM7/8/20
to Google Visualization API
Google Charts version '49' is now available. As before, you can use this upcoming version by loading 'upcoming'. Please test the new features and let us know if you experience any issues.
<script>
  google.charts.load('upcoming', {packages: ['corechart']});
</script>
Anticipated production release date: July 22, 2020
At this time, the 'current' version is still '48'.
On the release date, loading either 'current' or 'upcoming' will load '49'.
This release includes several more internal refactorings, so be aware of unintentional breakages. Code that has been affected includes all formatting classes, events, errors, parts of ChartEditor, ChartWrapper, ControlWrapper, Corecharts, Corechart axis ticks, GeoChart, and Query.
- VegaChart
- New chart type, now released in beta.
- A VegaChart is a wrapper for all of the many possible visualizations that may be specified using the Vega Visualization Grammar and drawn using data from DataTables like other charts. In future releases, we will further integrate the features of Google Charts and Vega.
- Uses the vega-interpreter to remain compliant with Content Security Policy restrictions.
- GeoChart
- geochartVersion option, specifies the border data version; default is 10, but 11 is now available.
- regioncoderVersion option, specifies the region coder data version; default is 0, but 1 is now available.
- Gantt Chart
- Added sortTasks option, default value true, to sort the tasks normally, or if false, use the same order as the rows in the DataTable.
- Query
- The JSON response option now requires that the server returns strict JSON.
- Loader
- If google.charts.load() is called more than one time with different versions or different languages, the settings from the first load are used.
- Allows a version number, not just a version string.
- More backward compatibility tweaks to support redirects from the old jsapi loader.
- The autoload URL parameter must now be formatted as strict JSON, and URL encoded.
- The google.charts.load() call now returns a JavaScript Promise, so in addition to the other callback mechanisms, you can call your chart drawing function like this:
google.charts.load('upcoming', {packages: ['corechart']}).then(drawChart);
Daniel LaLiberte
Jul 23, 2020, 3:29:18 PM7/23/20
to Google Visualization API
As of July 23, 2020, loading 'current' will load version '49'. If this causes problems for your use of Google Charts, please let us know, but in the meantime, you can change 'current' to '48' to get the previous version.
See the Version History for details about this release and all previous versions.

Андрей Шапал
Jul 23, 2020, 8:30:56 PM7/23/20
to Google Visualization API
Hello,
We use the google vizualization here:
https://luckystreak.lv/breaklist.html
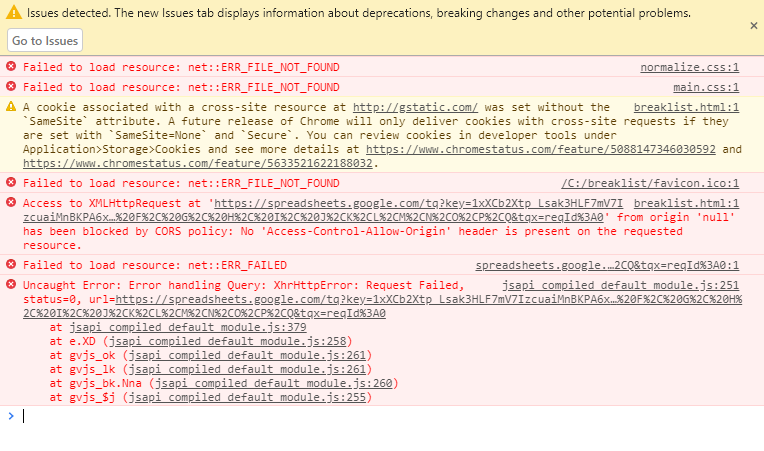
Just few hours ago the page stopped to work showing the qury response error.
In console the following errors were present:
After I have changed the code on this:
|| google.charts.load('48', {packages: ['table']});
The page started to work as usually.
четверг, 23 июля 2020 г. в 22:29:18 UTC+3, Daniel LaLiberte:
Daniel LaLiberte
Jul 23, 2020, 8:48:35 PM7/23/20
to Google Visualization API
Hi Андрей,
I believe this is due to the change in how the Query is done, such that it requires two things on the part of the server. I previously mentioned that the response must use strict JSON notation, if the server is returning a JSON response. But I neglected to mention that the server must also allow the cross-origin requests, and as part of that, the page that you are making the request from must also have a non-null origin since it appears that 'null' is not allowed as the origin by spreadsheets.google.com. I'll have to investigate whether this is intentional on the part of spreadsheets.google.com or some oversight.
I can't see your page at https://luckystreak.lv/breaklist.html to determine what is happening there. Is there some tricky way that the page is being loaded such that the page origin is lost?
I'm glad that you can switch to version '48' as a workaround. It may take some time before anything can be changed on spreadsheets.google.com, if there is anything to change.
--
You received this message because you are subscribed to the Google Groups "Google Visualization API" group.
To unsubscribe from this group and stop receiving emails from it, send an email to google-visualizati...@googlegroups.com.
To view this discussion on the web visit https://groups.google.com/d/msgid/google-visualization-api/8a8a82a1-b082-49ed-87c4-53e44b8845a0n%40googlegroups.com.
Андрей Шапал
Jul 23, 2020, 10:18:38 PM7/23/20
to Google Visualization API
Sure, I forgot the page access is allowed only from the office.
Thank you very much for your help! I hope the '48' will be not disabled later.
пятница, 24 июля 2020 г. в 03:48:35 UTC+3, Daniel LaLiberte:
Daniel LaLiberte
Jul 24, 2020, 3:16:48 PM7/24/20
to Google Visualization API
I don't know if this is related to why your domain appears to be 'null', but I can see that your page is loading the loader.js, and also loading the old jsapi loader, which now redirects to the new loader. You should stop loading jsapi in case that is causing the loader to be confused.
Possibly more directly related, your page does setTimeout("location.reload();",90000); which might reload the page in a way that loses the original domain. When you were using version '49', did the query work correctly the first time you load the page, and only fail after the reload call? If so, then we have a clue about what is happening.
To view this discussion on the web visit https://groups.google.com/d/msgid/google-visualization-api/0b343904-9362-41ba-aa93-18121c954959n%40googlegroups.com.
Андрей Шапал
Jul 24, 2020, 4:35:45 PM7/24/20
to Google Visualization API
Before that issue I was using jsapi only. But due to update was supposed to change for the new version.
I have made changes to show the issue:
As you can see, the error appears when the script is loaded for the first time. As I understand, that is not realted to the page reload.
Also, please, take a look on the link how I am gathering data for vizualization:
var query = new google.visualization.Query('https://spreadsheets.google.com/tq?key=1xXCb2Xtp_Lsak3HLF7mV7IzcuaiMnBKPA6x2HUxCKrM&output=html&range=B4:U40&headers=1&gid=451291128&&usp=sharing');
I am not sure if some restrictions were not applied here or changes, since we were using pretty old script (old but working).
пятница, 24 июля 2020 г. в 22:16:48 UTC+3, Daniel LaLiberte:
Daniel LaLiberte
Jul 24, 2020, 5:16:11 PM7/24/20
to Google Visualization API
I recreated your page on https://jsfiddle.net/dlaliberte/ok23q7v5/9/
and it works there, but only after I replaced your 'spreadsheets.google.com' URL with the one that it was redirected to:
Before I made that change, I saw this error:
?editor_console=true:1 Access to XMLHttpRequest at 'https://docs.google.com/spreadsheets/d/1xXCb2Xtp_Lsak3HLF7mV7IzcuaiMnBKPA6x2HUxCKrM/gviz/tq?output=html&range=B4:U40&headers=1&gid=451291128&&usp=sharing&tq=SELECT+B,+C,+D,+E,+F,+G,+H,+I,+J,K,L,M,N,O,P,Q&tqx=reqId:0' (redirected from 'https://spreadsheets.google.com/tq?key=1xXCb2Xtp_Lsak3HLF7mV7IzcuaiMnBKPA6x2HUxCKrM&output=html&range=B4:U40&headers=1&gid=451291128&&usp=sharing&tq=SELECT%20B%2C%20C%2C%20D%2C%20E%2C%20F%2C%20G%2C%20H%2C%20I%2C%20J%2CK%2CL%2CM%2CN%2CO%2CP%2CQ&tqx=reqId%3A0') from origin 'https://fiddle.jshell.net' has been blocked by CORS policy: No 'Access-Control-Allow-Origin' header is present on the requested resource.
So the problem you are seeing was not due to your location.reload() which resulted in the origin being 'null' (though that might *also* be another problem) but that the redirect occurs from 'spreadsheets.google.com' to 'docs.google.com/spreadsheets' in a way that is blocked because of the "No 'Access-Control-Allow-Origin' header is present on the requested resource". That would seem to be a bug in the redirect, which otherwise ought to behave the same as if the redirect were avoided. As a workaround, it seems you can instead use the URL that is redirected to. The next question is if this will keep working after your location.reload() calls.
To view this discussion on the web visit https://groups.google.com/d/msgid/google-visualization-api/dc7ca328-43d8-48ca-8df5-b660fa8ca36en%40googlegroups.com.
Андрей Шапал
Jul 24, 2020, 6:11:46 PM7/24/20
to Google Visualization API
Yep! That works great.
Thank you very much.
The reloading works nice. But I already planned to make some changes and instead of reloading the page, reload the function.
суббота, 25 июля 2020 г. в 00:16:11 UTC+3, Daniel LaLiberte:

Georgi Koshov
Dec 2, 2020, 12:49:28 PM12/2/20
to Google Visualization API
Hey! I'm interested in the development roadmap for VegaChart. I am currently researching adopting the vega grammar spec and would like to find out if this is a direction that the Charts team is looking to maintain, or an experiment that might get dropped?
Daniel LaLiberte
Dec 2, 2020, 1:34:48 PM12/2/20
to Google Visualization API
Hi Georgi,
I am expecting that VegaChart will be the basis for internally reimplementing all the existing charts, as well as many new ones, while preserving the same API for each chart. The features outside of individual charts, such as Query, DataTable, and Dashboard will be maintained, and better integrated with VegaChart as well.
In the next release, which might happen in the next few weeks, we have added support to VegaChart so you can specify VegaLite and VegaEmbed specs. We also have a Matrix chart that uses VegaChart internally, but it is not quite ready for release.
To view this discussion on the web visit https://groups.google.com/d/msgid/google-visualization-api/2e502fb4-7775-46d5-b224-d0c0b00737c1n%40googlegroups.com.
Georgi Koshov
Dec 4, 2020, 10:20:53 AM12/4/20
to Google Visualization API
Thanks for the reply, Daniel - this is really good news!
I have one more question, but this may not be the right forum for it. Are you aware if the Slides API is going to expose this component at some point?
Daniel LaLiberte
Dec 4, 2020, 1:27:35 PM12/4/20
to Google Visualization API
Slides, Sheets, and other docs now use a separate implementation of charts, as far as I am aware. The split started a couple years ago, when the docs team wanted better support for mobile platforms, which was a problem for the Google Charts architecture at the time. Maybe after we reimplement all charts via VegaCharts, there will be a migration back, especially if many more chart types and features can be supported with less effort.
To view this discussion on the web visit https://groups.google.com/d/msgid/google-visualization-api/a7cdebb0-11c2-4018-b26f-41ca5dd67905n%40googlegroups.com.
Reply all
Reply to author
Forward
0 new messages