Suppress crosshairs when legend entry has focus, when lines and points are both displayed in Line Chart
39 views
Skip to first unread message

David Burton
Oct 20, 2016, 2:55:19 PM10/20/16
to Google Visualization API
After posting this question on stackoverflow, it occurred to me that maybe what I'm seeing is just a plain bug. Anyhow, if it's a feachur, IMO it's a six-legged one. So I'm duplicating it here.
This is where I posted it on stackoverflow:
http://stackoverflow.com/questions/40158642/suppress-crosshairs-when-legend-entry-has-focus-when-lines-and-points-are-both
Nice, eh? But here's what it looks like when hovering over the corresponding legend entry:
This is where I posted it on stackoverflow:
http://stackoverflow.com/questions/40158642/suppress-crosshairs-when-legend-entry-has-focus-when-lines-and-points-are-both
Crosshairs are a nifty feature of Google Charts, but if you have them enabled for a line chart in which the individual points are emphasized (by setting pointSize to slightly larger than lineWidth), then they do something unpleasant: when the user hovers over the corresponding legend entry, the crosshairs will appear for every data point in that graph trace! If you have hundreds of data points in that trace, having hundreds of crosshairs appear, all at once, makes an ugly mess.
This does not happen for line charts in which pointSize is not set (i.e., for which only the lines, and not the actual data points, are visible).
Is there any way to make crosshairs appear only when mousing over the data points on the graph, and not when mousing over the legend, in a line chart which has points made visible by setting pointSize?
Here's what the graph looks like when hovering over one of the data points:
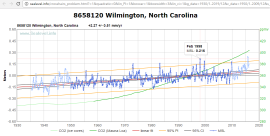
Nice, eh? But here's what it looks like when hovering over the corresponding legend entry:
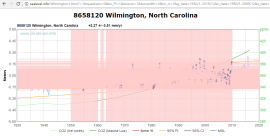
As you can see, the crosshairs cover up almost everything else.
Here's the web page that generated this graph:

Daniel LaLiberte
Oct 20, 2016, 3:14:03 PM10/20/16
to Google Visualization API
Hi David,
Definitely a bug. Maybe a centibug even, given how many legs show up. :) Thanks for your report.
We don't have enough control over when the crosshairs show up, and I can imagine a few useful options. Right now, it is very data oriented, only showing up when hovering over data items, or unintentionally, when hovering over legend items.
I suspect it would be more useful, in most cases, to show the crosshairs whenever the mouse is anywhere inside the chart area, and show the intersecting values on each axis. If we *only* did this, and did nothing more regarding hovering the data items, then there would be no problem with hovering legend items either.
--
You received this message because you are subscribed to the Google Groups "Google Visualization API" group.
To unsubscribe from this group and stop receiving emails from it, send an email to google-visualization-api+unsub...@googlegroups.com.
To post to this group, send email to google-visualization-api@googlegroups.com.
Visit this group at https://groups.google.com/group/google-visualization-api.
To view this discussion on the web visit https://groups.google.com/d/msgid/google-visualization-api/b1577e01-82d9-4c8b-9158-c07414024143%40googlegroups.com.
For more options, visit https://groups.google.com/d/optout.
Reply all
Reply to author
Forward
0 new messages