date an time / line diagram
59 views
Skip to first unread message

meinolf lutter
Dec 18, 2021, 4:55:09 AM12/18/21
to Google Visualization API
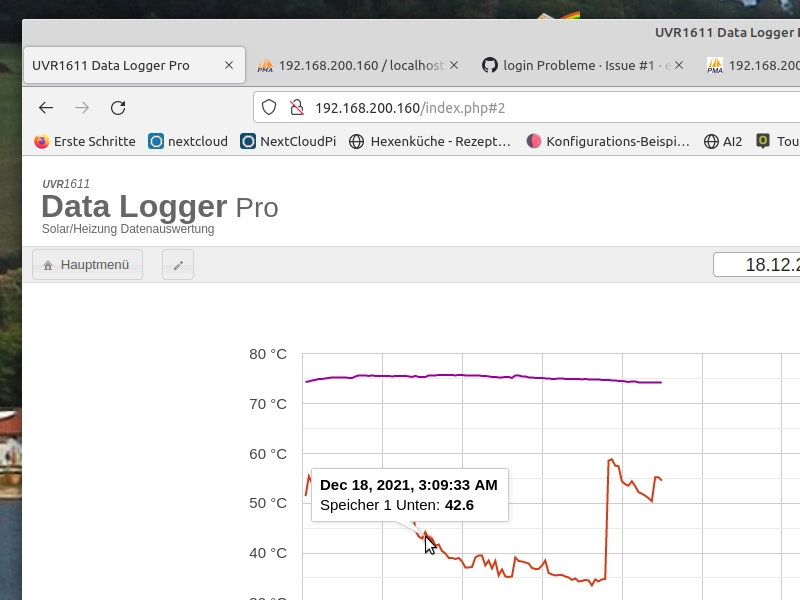
when i go on the line with the mouse, the date and time are displayed. i would like to have the time displayed in 24 hour mode. who has an idea how I can do it. or in which part of the program this is specified?
best
meinolf

Ray Thomas
Jan 29, 2022, 2:49:09 PM1/29/22
to Google Visualization API
Did you ever figure this out?
Sometimes the documentation doesn't appear very clear to me but there seems to be several ways you can do this.
1) Add a column to the data before it gets imported
You can create a new column and add information to that calculated from the other columns. An advantage of this is you can use whatever language you feel comfortable with. After you import it into the Google data table you can assign the role of tooltip to it by using setColumnProperty. For example data.setColumnProperty(4, 'role', 'tooltip');
2) Add a column to the data table after it has been imported.
See https://developers.google.com/chart/interactive/docs/reference?hl=en#DataTable_addColumn and then calculate the tooltip value using setColumns - https://developers.google.com/chart/interactive/docs/reference#DataView_setColumns
The column role as tooltip can be set in either method. This might help show what you are trying to do - https://stackoverflow.com/questions/46613501/how-to-add-a-style-role-column-to-a-google-charts-aggregated-datatable
3) Change the formatted value of the date column cells
The Google data table cells can contain two values, the "real" value and a formatted value. Where it can the API uses the formatted value.The documentation has methods for getting and setting both values - look for setCell,
getValue,
getFormattedValue,
setValue, and setFormattedValue on https://developers.google.com/chart/interactive/docs/reference
Doing this means creating a loop by getting the number of rows in the column using getNumberOfRows() then loop through each row, getting the value of whatever column hold the date using getValue and writing a new formatted version of it using either setCell or setFomattedValue.
var totalRows = data.getNumberOfRows();
for (i = 0; i < totalRows; i++) {
var dateValue =
getValue(i,2)
// Do whatever you want to the date value
// Do whatever you want to the date value
setFormattedValue(i, 2, dateValue)
}
}
Reply all
Reply to author
Forward
0 new messages