Need help with crosshair lines on line graph
18 views
Skip to first unread message

Jared Sams
Jan 2, 2022, 6:15:47 PM1/2/22
to Google Visualization API
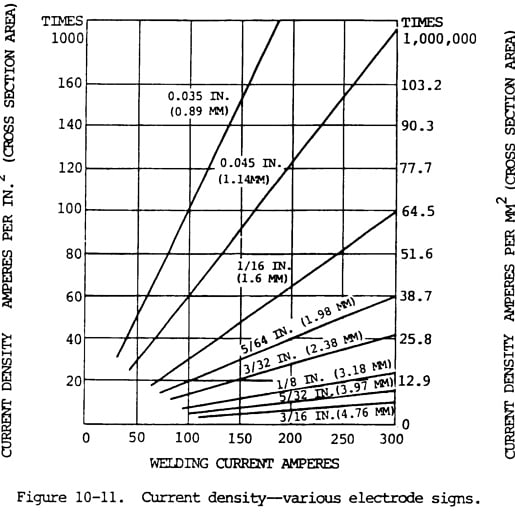
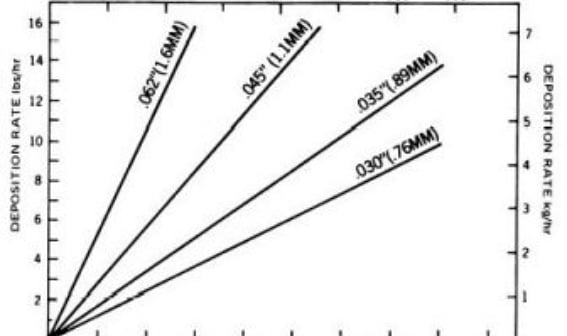
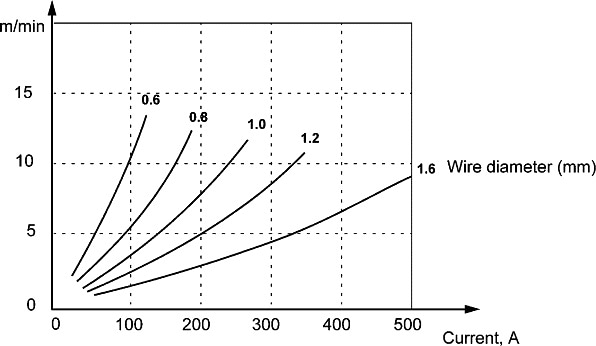
I have an image that's essentially a x and y axis with different lines on it. The lines represent different wire diameters. One axis is a wire feed speed in inches per minute. The other acis is the equivalent amperage. I want to be able to hover over a wire diameter line with cross hairs and have displayed the ipm and amps. Anyone in here smart enough to help?
Reply all
Reply to author
Forward
0 new messages