How to customize charts by adding html to data row cells?
18 views
Skip to first unread message

Pedro Milheiro
Jun 12, 2017, 12:09:53 PM6/12/17
to Google Visualization API
Hello,
I need to add html to column cells in order to change the apearence of the columns (Jun, Jul, Ago) of the below chart from this:

to this:
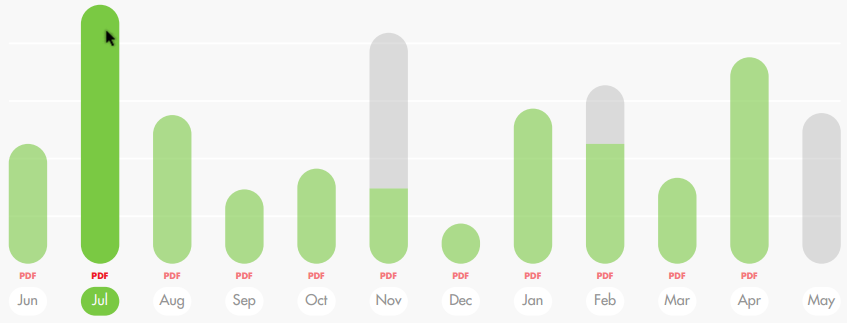
(i.e., I need to change the apearance of name of the months and to include a PDF link above each month).
I could not find how html to charts in the documentation, only to tables. I tried to use the option "allowHtml: true" but without success; it looks like this option it is only available to tables.
I found some partial solutions online to this problem but they have several year, so I wonder if the API has evolved to allow html on charts. Is this possible to do?
Looking forward to know your suggestions, Thanks!
Reply all
Reply to author
Forward
0 new messages