Simple column chart not working..new to all this api
30 views
Skip to first unread message

Victor Wong
Nov 22, 2020, 6:27:21 PM11/22/20
to Google Visualization API
Hi,
I'm a student and I'm trying to figure out why my column chart doesn't work..
Can anyone assist?
I can't seem to attach my folder here..is there a reason why?
Thx
Victor!

"Mudassir Ali Khaja (ⓜⓐⓛⓘⓚ)"
Nov 22, 2020, 6:39:50 PM11/22/20
to google-visua...@googlegroups.com
Can u attach the chart options and the sample chart data you were using..
Thanks,
Mudassir Ali Khaja
Phone: (660)441-1485
On Nov 22, 2020, at 6:27 PM, Victor Wong <won...@gmail.com> wrote:
--
You received this message because you are subscribed to the Google Groups "Google Visualization API" group.
To unsubscribe from this group and stop receiving emails from it, send an email to google-visualizati...@googlegroups.com.
To view this discussion on the web visit https://groups.google.com/d/msgid/google-visualization-api/a1e7075c-3cba-4a25-a86e-276bbb15c15bn%40googlegroups.com.
Victor Wong
Nov 22, 2020, 6:54:28 PM11/22/20
to google-visua...@googlegroups.com
Thank you for the response! Mr. Mudassir Ali Khaja!
The .js code was just copied from the site ( https://developers.google.com/chart/interactive/docs/animation?hl=en )
when I came across googles dev site for bar charts because it had a nice button that you can click and it renders the column chart to 'reduce' or 'expand'.
The chart doesn't even appear on the html when I bring it up on a browser..sorry sir, I'm kind of clueless..
Your assistance in this is most kind!
Victor Wong
this is my googlebarchrt3.html page:
<button type="button" id="b1" onclick="init();" >Click me!</button>
<script type="text/javascript" src="googlebarchrt3.js" charset="utf-8"></script>
<body>
<div id="chart_div" style="width: 700px; height: 600px;"></div>
</body>
this is my googlebarchrt3.js file:
google.load("visualization", "1", {packages: ["corechart"]});
google.charts.setOnLoadCallback(init);
function init() {
var options = {
width: 700,
height: 600,
animation:{
duration: 1000,
easing: 'out',
},
vAxis: {minValue:0, maxValue:1000}
};
var data = new google.visualization.DataTable();
data.addColumn('string', 'N');
data.addColumn('number', 'Value');
data.addRow(['V', 200]);
var chart = new google.visualization.ColumnChart(
document.getElementById('visualization'));
var button = document.getElementById('b1');
function drawChart() {
// Disabling the button while the chart is drawing.
button.disabled = true;
google.visualization.events.addListener(chart, 'ready',
function() {
button.disabled = false;
});
chart.draw(data, options);
}
button.onclick = function() {
var newValue = 1000 - data.getValue(0, 1);
data.setValue(0, 1, newValue);
drawChart();
};
drawChart();
}
To view this discussion on the web visit https://groups.google.com/d/msgid/google-visualization-api/9B50C0BF-0F89-405C-A15A-D4C991684AD1%40gmail.com.
Mudassir Ali Khaja
Nov 22, 2020, 8:55:02 PM11/22/20
to google-visua...@googlegroups.com
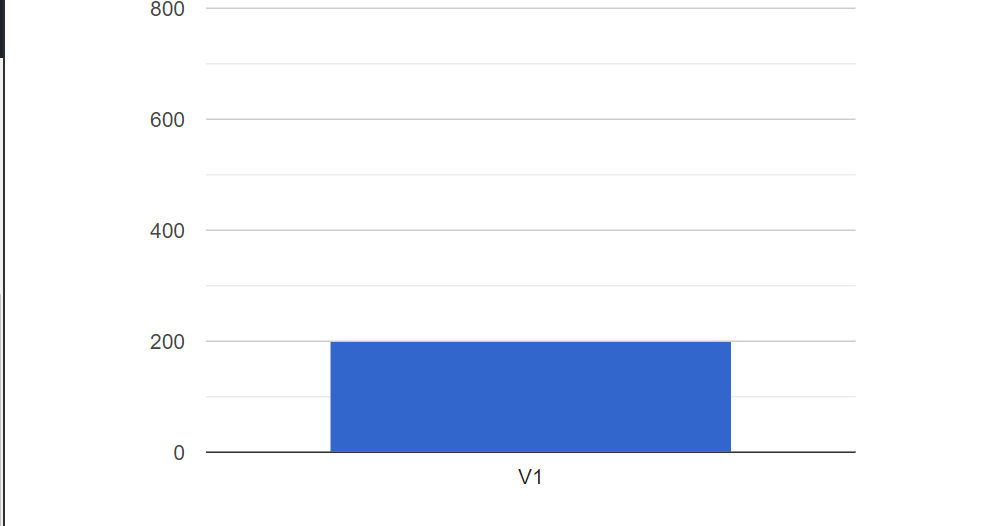
Referring to wrong element: Please update this line: Should be fixed:
var chart = new google.visualization.ColumnChart(
document.getElementById('chart_div'));
Here is the output:
Thanks,
Mudassir Ali Khaja,To view this discussion on the web visit https://groups.google.com/d/msgid/google-visualization-api/CAJAzQQuvZnZVNQ2Nx6akF%2BjwAPxCahaaSpt-HpdDyWmBOo7B2Q%40mail.gmail.com.
Victor Wong
Nov 22, 2020, 9:11:27 PM11/22/20
to google-visua...@googlegroups.com
Thank you Sir!
That was extremely helpful!! and Appreciated!! It's always something insignificant!!
Thanks again!!
Victor!
To view this discussion on the web visit https://groups.google.com/d/msgid/google-visualization-api/CAOOfcRSGfFtEHbH5HAgug36MGrvAVQNAvcOsr2N5SfcLrrQQdA%40mail.gmail.com.
Reply all
Reply to author
Forward
0 new messages