Plotting time intervals as a continuous axis?
1,291 views
Skip to first unread message

Don Norman
Feb 27, 2015, 2:49:33 PM2/27/15
to google-visua...@googlegroups.com
Hello,
I have a line graph set up using time intervals and I would like to use a trending line, however those are only available with continuous axes.
There is already 'number', 'date', 'datetime' and 'timeofday' available as a continuous axis, it would be really nice to have 'interval' added as a continuous axis as well.
Here's an example of the graph that I have, it's showing a number of events across an interval of time.
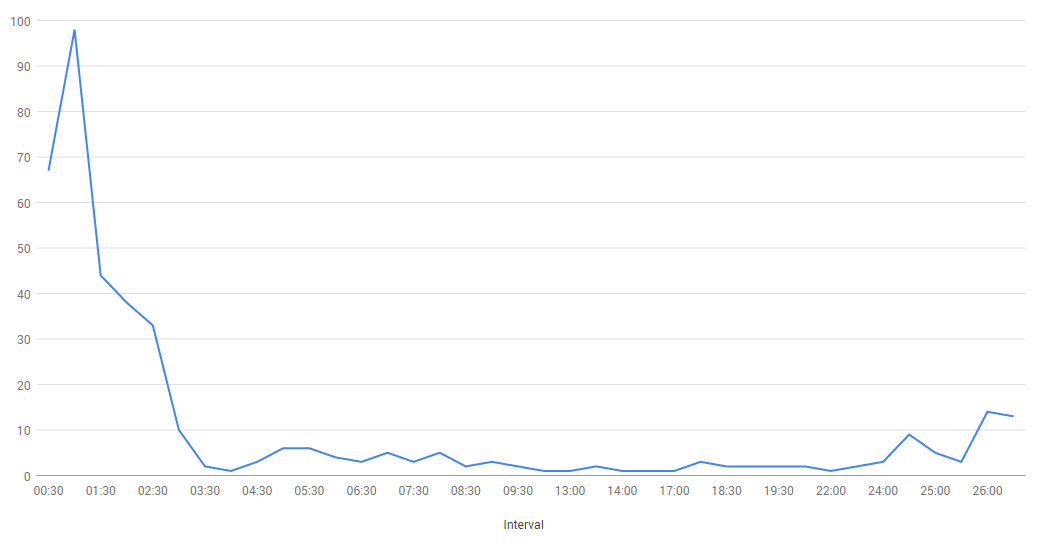
The intervals are technically continuous since they are every 30 minutes, but are not displayed that way due to 'string' being the only column type that the API will allow me to use with them.
Is there a way to achieve this with the currently available API options? I was thinking that I could use 'timeofday' but it did not like the input values (00:00, 00:30) for that type.
Thanks,
-Don

Sergey Grabkovsky
Feb 27, 2015, 2:55:23 PM2/27/15
to google-visua...@googlegroups.com
Hi Don,
I think timeofday is what you want, but you need to match the format that it expects, which is not a string. It expects an array of numbers. Take a look at this documentation page for an example of how to use it: https://developers.google.com/chart/interactive/docs/datesandtimes#timeofday
I think timeofday is what you want, but you need to match the format that it expects, which is not a string. It expects an array of numbers. Take a look at this documentation page for an example of how to use it: https://developers.google.com/chart/interactive/docs/datesandtimes#timeofday
--
You received this message because you are subscribed to the Google Groups "Google Visualization API" group.
To unsubscribe from this group and stop receiving emails from it, send an email to google-visualizati...@googlegroups.com.
To post to this group, send email to google-visua...@googlegroups.com.
Visit this group at http://groups.google.com/group/google-visualization-api.
For more options, visit https://groups.google.com/d/optout.
Don Norman
Feb 27, 2015, 3:42:16 PM2/27/15
to google-visua...@googlegroups.com
Hi Sergey,
I'll try it though and see how it turns out. I may just have to normalize the time range of the events so they sit nicely on top of each other in a graph.
Thanks!
-Don
On Friday, February 27, 2015 at 2:55:23 PM UTC-5, Sergey wrote:
Hi Don,
I think timeofday is what you want, but you need to match the format that it expects, which is not a string. It expects an array of numbers. Take a look at this documentation page for an example of how to use it: https://developers.google.com/chart/interactive/docs/datesandtimes#timeofday
On Fri, Feb 27, 2015 at 2:49 PM Don Norman <norm...@gmail.com> wrote:
Hello,--I have a line graph set up using time intervals and I would like to use a trending line, however those are only available with continuous axes.There is already 'number', 'date', 'datetime' and 'timeofday' available as a continuous axis, it would be really nice to have 'interval' added as a continuous axis as well.Here's an example of the graph that I have, it's showing a number of events across an interval of time.
The intervals are technically continuous since they are every 30 minutes, but are not displayed that way due to 'string' being the only column type that the API will allow me to use with them.Is there a way to achieve this with the currently available API options? I was thinking that I could use 'timeofday' but it did not like the input values (00:00, 00:30) for that type.Thanks,-Don
You received this message because you are subscribed to the Google Groups "Google Visualization API" group.
To unsubscribe from this group and stop receiving emails from it, send an email to google-visualization-api+unsub...@googlegroups.com.
Sergey Grabkovsky
Feb 27, 2015, 4:24:34 PM2/27/15
to google-visua...@googlegroups.com
That's exactly what the purpose of the 'timeofday' format is. It models a time relative to some arbitrary 0:00. If you did want to model it anchored to a specific point in time, you would use the 'datetime' type, which is simply a Date object with time in it.
To unsubscribe from this group and stop receiving emails from it, send an email to google-visualizati...@googlegroups.com.
Message has been deleted
Don Norman
Mar 2, 2015, 4:19:17 PM3/2/15
to google-visua...@googlegroups.com
Sorry if this is a double post, I forget if I submitted it already or not.
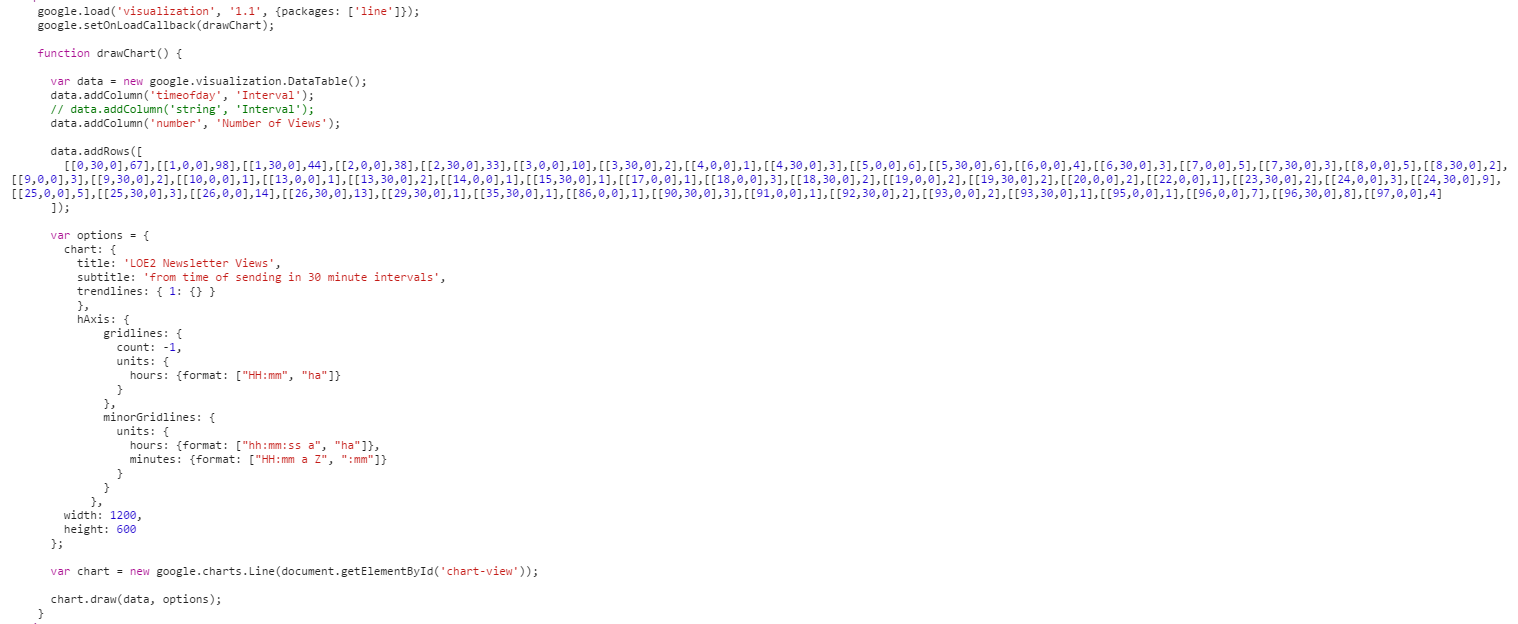
So I tried the 'timeofday' column type, and changed the data from being formatted as 00:00:00 to an array of hours, minutes and seconds.
No matter where I put the hAxis formatting options I can't get the labels to show as time intervals as opposed to being a day or part of a day.
Here's a snippet of the code:
Here's how it renders in the browser:

Also, now hovering over the data points causes a red error box to appear above the chart, but there's no information sent to the javascript console.
Any thoughts as to what I am doing wrong? I thought using 'timeofday' would render like my intervals when they were strings, i.e. '00:30:00', '1:30:00', etc.
This is the documentation that I am going off of: https://developers.google.com/chart/interactive/docs/datesandtimes#timeofday
Thanks,
-Don
On Friday, February 27, 2015 at 4:24:34 PM UTC-5, Sergey wrote:
That's exactly what the purpose of the 'timeofday' format is. It models a time relative to some arbitrary 0:00. If you did want to model it anchored to a specific point in time, you would use the 'datetime' type, which is simply a Date object with time in it.
On Fri, Feb 27, 2015 at 3:42 PM Don Norman <norm...@gmail.com> wrote:
Hi Sergey,I had originally thought that 'timeofday' wouldn't be appropriate because I assumed it was related to a specific point in time. The 30 minute intervals that I am working with aren't really related to any specific point in time, because the events that I am tracking could start at a different time on any given day. And rather than have different start times for them all, I was plotting them along intervals in which they happened from a 00:00 starting point; regardless of when that actual starting point happened.I'll try it though and see how it turns out. I may just have to normalize the time range of the events so they sit nicely on top of each other in a graph.Thanks!-Don
On Friday, February 27, 2015 at 2:55:23 PM UTC-5, Sergey wrote:Hi Don,
I think timeofday is what you want, but you need to match the format that it expects, which is not a string. It expects an array of numbers. Take a look at this documentation page for an example of how to use it: https://developers.google.com/chart/interactive/docs/datesandtimes#timeofdayOn Fri, Feb 27, 2015 at 2:49 PM Don Norman <norm...@gmail.com> wrote:
Hello,--I have a line graph set up using time intervals and I would like to use a trending line, however those are only available with continuous axes.There is already 'number', 'date', 'datetime' and 'timeofday' available as a continuous axis, it would be really nice to have 'interval' added as a continuous axis as well.Here's an example of the graph that I have, it's showing a number of events across an interval of time.
The intervals are technically continuous since they are every 30 minutes, but are not displayed that way due to 'string' being the only column type that the API will allow me to use with them.Is there a way to achieve this with the currently available API options? I was thinking that I could use 'timeofday' but it did not like the input values (00:00, 00:30) for that type.Thanks,-Don
You received this message because you are subscribed to the Google Groups "Google Visualization API" group.
To unsubscribe from this group and stop receiving emails from it, send an email to google-visualization-api+unsubscr...@googlegroups.com.
Sergey Grabkovsky
Mar 2, 2015, 5:23:26 PM3/2/15
to google-visua...@googlegroups.com
Hi Don,
In the future, please post your code in text, and not a screenshot. This will make it easier for us to reproduce your issue and help you. I had to run your screenshot through an OCR website, and do a number of manual corrections in order to play around with it.
In the future, please post your code in text, and not a screenshot. This will make it easier for us to reproduce your issue and help you. I had to run your screenshot through an OCR website, and do a number of manual corrections in order to play around with it.
The red error box is a bug, so thank you for reporting it. If you're curious, it occurs when formatting options for a date-based axis are omitted. It will be fixed with our next release.
Also, it appears that custom formatting for date-based axes (including timeofday) is completely broken in the Material Charts. This will also be fixed with the next release.
Another thing I noticed is that you're using the old-style of options, without converting them (via google.charts.Line.convertOptions), which means that most of your options are currently being ignored. Another thing is that the Material Charts do not yet support most of the options that you're used to (like trendlines, minorGridlines, gridline.count (although we do support pixelsPerTick, but you'll have to specify it using the new options structure; but that's neither here nor there since you're just using the automatic tick algorithm (which is also not supported)), and unit-based ticks).
To post to this group, send email to google-visualization-api@googlegroups.com.
Reply all
Reply to author
Forward
0 new messages