"Extra" lines in OrgChart
45 views
Skip to first unread message

Jackie McHenry
Apr 6, 2021, 12:20:51 PM4/6/21
to Google Visualization API
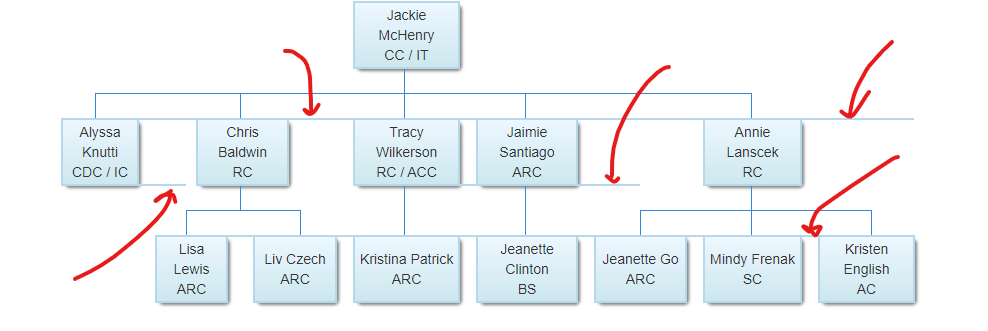
What could be causing the "extra" lines in my orgChart? Any way to remove them?
<script type="text/javascript" src="https://www.gstatic.com/charts/loader.js"></script>
<script>
google.charts.load('current', {packages:["orgchart"]});
google.charts.setOnLoadCallback(drawChart);
function drawChart() {
var data = new google.visualization.DataTable();
data.addColumn('string', 'Name');
data.addColumn('string', 'Manager');
data.addColumn('string', 'ToolTip');
// For each orgchart box, provide the name, manager, and tooltip to show.
data.addRows([
@php
$rowcount = count($coordinator_array);
//Now make the tree
for($a=0;$a<$rowcount;$a++){
$first_name = str_replace(array("'", "\"", """), "", htmlspecialchars($coordinator_array[$a]['first_name'] ) );
$last_name = str_replace(array("'", "\"", """), "", htmlspecialchars($coordinator_array[$a]['last_name'] ) );
echo "[{v:'" . $coordinator_array[$a]['id'] . "', f:'". $first_name . " " . $last_name . "<br>" . $coordinator_array[$a]['position_title'];
if ($coordinator_array[$a]['sec_position_title']!="")
echo " / " . $coordinator_array[$a]['sec_position_title'];
echo "'},'";
if ($coordinator_array[$a]['report_id']==366 && $cord_pos_id == 7)
echo "'";
else if($coordinator_array[$a]['report_id']==1 && $cord_pos_id != 7)
echo "'";
else
echo $coordinator_array[$a]['report_id'] . "'";
echo ",''],\n"; // '" . $coordinator_array[$a]['chapter_list'] . "'],\n";
}
@endphp
]);
// Create the chart.
var chart = new google.visualization.OrgChart(document.getElementById('chart_div'));
// Draw the chart, setting the allowHtml option to true for the tooltips.
chart.draw(data, {allowHtml: true, allowCollapse: true, size: 'small'});
}
</script>
Reply all
Reply to author
Forward
0 new messages