column chart with multiple background colors
86 views
Skip to first unread message

Linda van Engelen
Oct 11, 2021, 6:57:21 AM10/11/21
to Google Visualization API
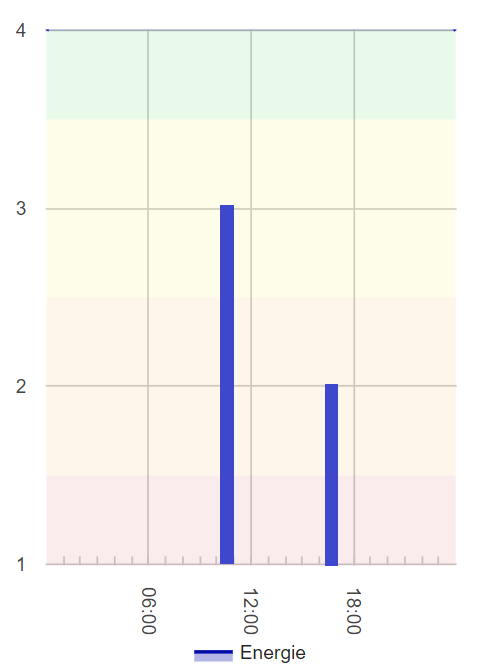
I am looking for a chart with multiple backgroundcolors, and for the data columns. (see image)
I found this: https://stackoverflow.com/questions/39669997/variable-background-colors-in-google-line-chart
So i made a combo chart with stacked area and a line. And that worked.
But i want the line to be a column. And for some reason i cannt get it to work.
i tried to make 2 y-axis (left for the columns, right for the areas with colors). But the column is still nog working.
Can someone help me?
My chart-options:
options = {
title : obj.psTitle,
width : breedte,
height : hoogte,
legend: { position: 'bottom' },
chartArea: {
// backgroundColor: {
// fill: '#FF0000',
// fillOpacity: 0.1,
// },
width: '80%',
height: '70%'
},
isStacked: true,
seriesType: 'area',
vAxis: {
1: {
ticks: ticknummers,
viewWindow: {
min: 1,
max: obj.piMaxNiveaus
},
2: {
ticks: ticknummers,
viewWindow: {
min: 1,
max: obj.piMaxNiveaus
}
}
},
hAxis: {
format:'HH:mm',
slantedText: true,
slantedTextAngle: -90,
gridlines: {
hours: {format: 'HH:mm'}
},
viewWindow: {
min: new Date(obj.piJaarNr, (obj.piMaandNr-1), obj.piDagNr, 00, 01),
max: new Date(obj.piJaarNr, (obj.piMaandNr-1), obj.piDagNr, 23, 59)
}
},
series: {
// Niv1
0: {
areaOpacity: 0.1,
color: (kleur1),
visibleInLegend: false,
lineWidth: 0,
targetAxisIndex: 2
},
// Niv2
1: {
areaOpacity: 0.1,
color: (kleur2),
visibleInLegend: false,
lineWidth: 0,
targetAxisIndex: 2
},
// Niv3
2: {
areaOpacity: 0.1,
color: (kleur3),
visibleInLegend: false,
lineWidth: 0,
targetAxisIndex: 2
},
// Niv4
3: {
areaOpacity: 0.1,
color: (kleur4),
visibleInLegend: false,
lineWidth: 0,
targetAxisIndex: 2
},
// Niv5
4: {
areaOpacity: 0.1,
color: (kleur5),
visibleInLegend: false,
lineWidth: 0,
targetAxisIndex: 2
},
// Energie
5: {
color: '#000BA8',
type: 'column',
visibleInLegend: true,
targetAxisIndex: 1
},
}
};
Reply all
Reply to author
Forward
0 new messages