Google Line Chart with data from MYSQL

Vojtěch Piska
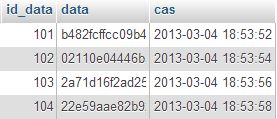
code in file graf.php :<?php$con = mysql_connect("localhost","root","123456");mysql_select_db("aplikace", $con);$result = mysql_query("SELECT * FROM data");
while ($row=mysql_fetch_array($result)){ $pole[]= array( 'cas' => $row['cas'], 'data'=> $row['data'] );
} echo json_encode($pole);?>
Code in get_json.html
<html><head><script type="text/javascript" src="https://www.google.com/jsapi"></script><script type="text/javascript" src="http://ajax.googleapis.com/ajax/libs/jquery/1.7.1/jquery.min.js"></script><script type="text/javascript">google.load("visualization", "1", {packages:["corechart"]});google.setOnLoadCallback(drawChart);function drawChart() {var jsonData = $.ajax({url: "graf.php",dataType:"json",async: false}).responseText;// Create our data table out of JSON data loaded from server.var data = new google.visualization.DataTable(jsonData);var options = {width: 800, height: 480,title: 'Company Performance'};var chart = new google.visualization.LineChart(document.getElementById('chart_div'));chart.draw(data, options);}</script></head>
<body><div id="chart_div"></div></body></html>
If you can help me plese, I really dont know what to do and time is kicking me:/
I also added source files. Thanks a lot:)

asgallant
Vojtěch Piska
Dne pondělí, 4. března 2013 21:56:44 UTC+1 asgallant napsal(a):
Vojtěch Piska
Dne pondělí, 4. března 2013 21:38:13 UTC+1 Vojtěch Piska napsal(a):
Vojtěch Piska
I want to display in to the similar chart: 
Dne pondělí, 4. března 2013 21:38:13 UTC+1 Vojtěch Piska napsal(a):
Hi friends,
asgallant
Vojtěch Piska
Dne pondělí, 4. března 2013 21:38:13 UTC+1 Vojtěch Piska napsal(a):
Hi friends,

Liviu
