ReferenceError: Hh is not defined
626 views
Skip to first unread message

Oleksandr Gochu
Feb 24, 2016, 9:06:58 PM2/24/16
to Google Visualization API
Hi, I'm stuck on one problem.
All of my team can see properly data on
but I am not .
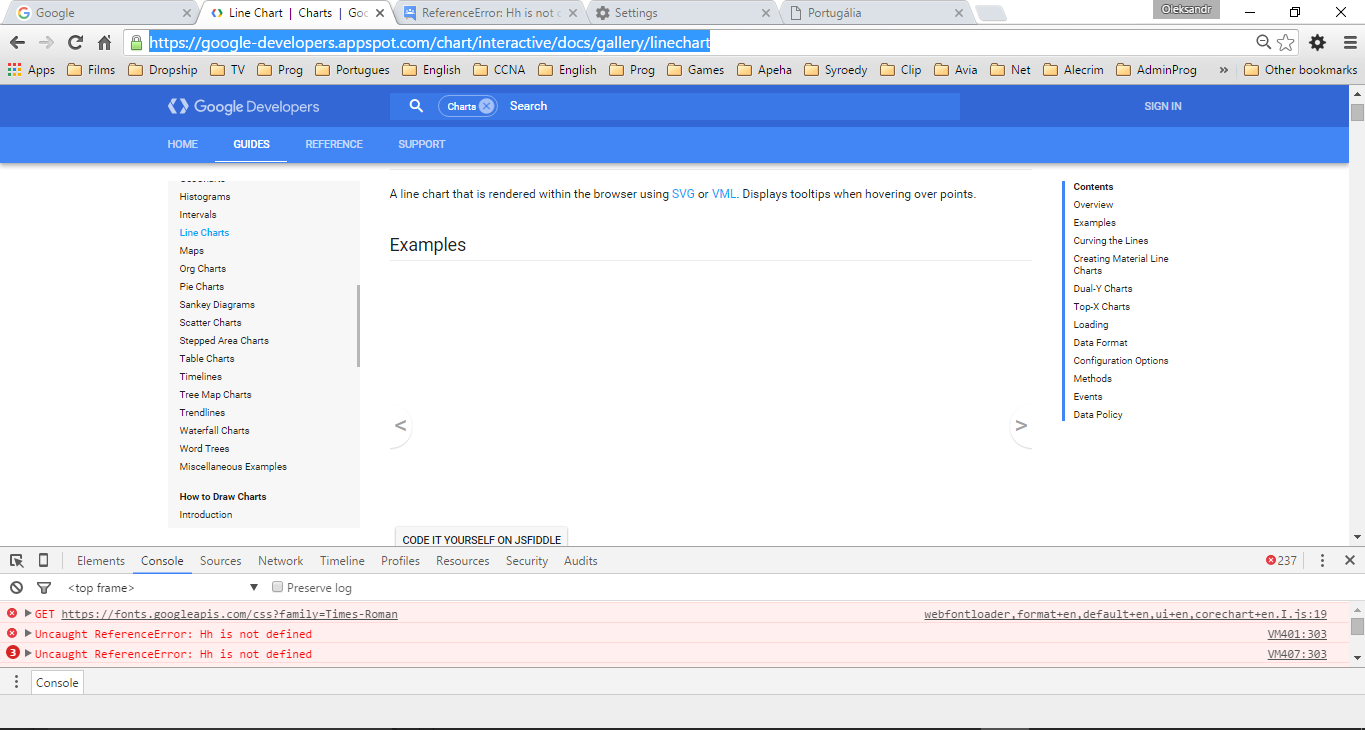
I've received a banch of console errors in "Developer tools"
...
Uncaught ReferenceError: Hh is not defined
Uncaught TypeError: current is not a function
Uncaught TypeError: google.visualization.DataTable is not a function
...
I'm working on Windows 8.1 Chrome 48.0.2564.116 m (the same thing apeares on recent versions of Opera, FireFox e IE).
Any ideas?
Oleksandr Gochu
Feb 25, 2016, 6:15:50 AM2/25/16
to Google Visualization API
Upgrading to Windows 10 doesn't resolve the problem, by the way Windows 8.1 licence from the box.
четвер, 25 лютого 2016 р. 02:06:58 UTC користувач Oleksandr Gochu написав:
Was installed most recent Adobe flash version. Is there existing some software (installed/uninstalled applications, turn on/off services) or hardware restrictions?
I've discovered limitation when trying develop my ruby on rails application. In attach new print-screen.
Hope exists some explication or solution for this.
Regards
четвер, 25 лютого 2016 р. 02:06:58 UTC користувач Oleksandr Gochu написав:

Daniel LaLiberte
Feb 25, 2016, 9:43:11 AM2/25/16
to Google Visualization API
I just announced release of v44, and it appears that when we push out a new version, there are some hiccups in the system until the changes fully propagate. If you get these kinds of errors, I suggest you refresh the page, flushing your cache if necessary. If a problem persists, please give us enough details, such as a working example, so that we can determine the cause of the problem. Thanks.
--
You received this message because you are subscribed to the Google Groups "Google Visualization API" group.
To unsubscribe from this group and stop receiving emails from it, send an email to google-visualizati...@googlegroups.com.
To post to this group, send email to google-visua...@googlegroups.com.
Visit this group at https://groups.google.com/group/google-visualization-api.
To view this discussion on the web visit https://groups.google.com/d/msgid/google-visualization-api/6a6afe2d-806b-4966-ba13-e25c75b603d2%40googlegroups.com.
Oleksandr Gochu
Feb 25, 2016, 2:16:50 PM2/25/16
to Google Visualization API
Good afternoon
From the begining I want to thank you for attention and support.
About my problem it still on "course".
Finally in today the morning(~9 hores ago) I can get the visual representation on your site and in my app, but it was enabled through a couple hours and little after tha tit was "unenabled" for another time.
After making cache and cookies cleaning, in this moment, I have no ability to see charts neither on site
After making cache and cookies cleaning, in this moment, I have no ability to see charts neither on site
nor in my application on the my working real machine. In the same time on the virtual machine where was installed, for test purposes, Ubuntu OS I can see example charts(from your site) correctly.
In attach I send you print-screens with actual situation.
Hope to get your help.
Regards,
Oleksandr Gochu
четвер, 25 лютого 2016 р. 14:43:11 UTC користувач Daniel LaLiberte написав:
четвер, 25 лютого 2016 р. 14:43:11 UTC користувач Daniel LaLiberte написав:
I just announced release of v44, and it appears that when we push out a new version, there are some hiccups in the system until the changes fully propagate. If you get these kinds of errors, I suggest you refresh the page, flushing your cache if necessary. If a problem persists, please give us enough details, such as a working example, so that we can determine the cause of the problem. Thanks.
On Thu, Feb 25, 2016 at 6:15 AM, Oleksandr Gochu <goch...@gmail.com> wrote:
Upgrading to Windows 10 doesn't resolve the problem, by the way Windows 8.1 licence from the box.Was installed most recent Adobe flash version. Is there existing some software (installed/uninstalled applications, turn on/off services) or hardware restrictions?I've discovered limitation when trying develop my ruby on rails application. In attach new print-screen.Hope exists some explication or solution for this.Regards
четвер, 25 лютого 2016 р. 02:06:58 UTC користувач Oleksandr Gochu написав:Hi, I'm stuck on one problem.All of my team can see properly data onbut I am not .I've received a banch of console errors in "Developer tools"...Uncaught ReferenceError: Hh is not definedUncaught TypeError: current is not a functionUncaught TypeError: google.visualization.DataTable is not a function...I'm working on Windows 8.1 Chrome 48.0.2564.116 m (the same thing apeares on recent versions of Opera, FireFox e IE).Any ideas?
--
You received this message because you are subscribed to the Google Groups "Google Visualization API" group.
To unsubscribe from this group and stop receiving emails from it, send an email to google-visualization-api+unsub...@googlegroups.com.
To post to this group, send email to google-visua...@googlegroups.com.
Visit this group at https://groups.google.com/group/google-visualization-api.
To view this discussion on the web visit https://groups.google.com/d/msgid/google-visualization-api/6a6afe2d-806b-4966-ba13-e25c75b603d2%40googlegroups.com.

Якушев Владимир
Feb 25, 2016, 4:43:05 PM2/25/16
to Google Visualization API
I had the same porblem after new version 44 release today.
Fixed it by changing google.charts.load() from 'current' to '44'
четверг, 25 февраля 2016 г., 22:16:50 UTC+3 пользователь Oleksandr Gochu написал:

Teresa Gutierrez
Feb 28, 2016, 12:36:37 AM2/28/16
to Google Visualization API
Hola,
Esta publicación me ayudó a resolver el problema
Saludos.

Denis Giffeler
Feb 28, 2016, 7:37:20 AM2/28/16
to Google Visualization API
Fixed the problem for me, too. Thanks Vladimir!
Am Donnerstag, 25. Februar 2016 22:43:05 UTC+1 schrieb Vladimir Yakushev:
I had the same porblem after new version 44 release today.Fixed it by changing google.charts.load() from 'current' to '44'
...deletia...

Wim Pruiksma
Feb 29, 2016, 3:00:22 AM2/29/16
to Google Visualization API
I have the same problem with charts. Changed the version from 'current' to '44' it fixed the problem
Op donderdag 25 februari 2016 03:06:58 UTC+1 schreef Oleksandr Gochu:
Op donderdag 25 februari 2016 03:06:58 UTC+1 schreef Oleksandr Gochu:
Oleksandr Gochu
Feb 29, 2016, 9:24:58 AM2/29/16
to Google Visualization API
Thanks.
For development purposes it is perfect, but I still have no ability constantly view examples in the site.
понеділок, 29 лютого 2016 р. 08:00:22 UTC користувач Wim Pruiksma написав:
понеділок, 29 лютого 2016 р. 08:00:22 UTC користувач Wim Pruiksma написав:

Nicolás da Silva Santamaria
Mar 3, 2016, 10:33:52 AM3/3/16
to Google Visualization API
That solution helped in my case.
Thanks.
Nicolas
Thanks.
Nicolas
Daniel LaLiberte
Mar 3, 2016, 11:09:16 AM3/3/16
to Google Visualization API
All the loading problems should be resolved now. We found the cause of the problem, which was caching of redirects that were not updating as expected. We replaced the loader with a different way of mapping 'current' to '44' so it avoids the redirects. So everything that was failing for this reason should now be fixed.
Reply all
Reply to author
Forward
0 new messages