Issue with Area Series Data -- Chart is not rendering correctly

Greg Murdoch
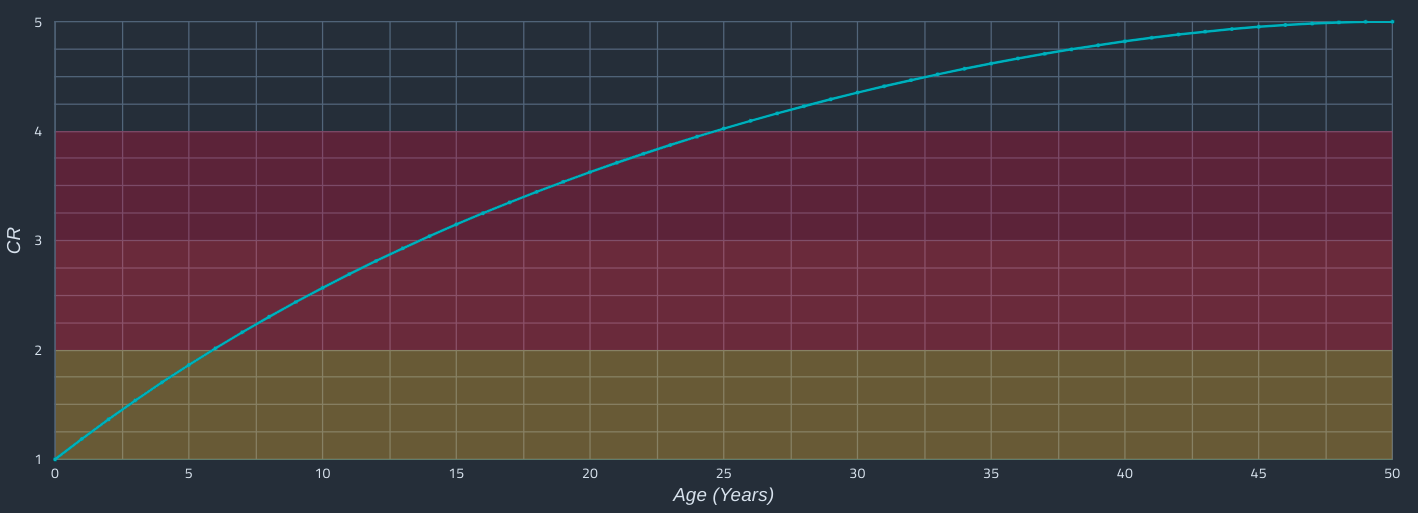
The colour bands on this chart are incorrect, except I don't know why! This is the only data set to have this issue, every other data set I run renders correctly.
The following is a sample of the map data:
Chart Data:
0:
0: {label: 'Age (years)', type: 'number'}
1: {label: 'DPA - Facility Element - CR', type: 'number'}
2: {label: 'color band 0', type: 'number'}
3: {label: 'color band 1', type: 'number'}
4: {label: 'color band 2', type: 'number'}
5: {label: 'color band 3', type: 'number'}
1: (6) [0, 1, 1, 1, 1, 1]
2: (6) [1, 1.187004897, 1, 1, 1, 1]
3: (6) [2, 1.3664860096, 1, 1, 1, 1]`
With 1, 1, 1, 1 (or the last 4 indexes of the data),
representing the area I want to colour.
The series information looks
like:
series:
0: {color: '#0DAFBD'}
1: {lineWidth: 0, color: '#71c94b', type: 'area', visibleInLegend: false, enableInteractivity: false, …}
2: {lineWidth: 0, color: '#fabf20', type: 'area', visibleInLegend: false, enableInteractivity: false, …}
3: {lineWidth: 0, color: '#F2203E', type: 'area', visibleInLegend: false, enableInteractivity: false, …}
4: {lineWidth: 0, color: '#C40A3B', type: 'area', visibleInLegend: false, enableInteractivity: false, …}`
Which is correct, and in the same format as I generate for other charts that don't have this problem. The options passed to this chart are below, have I done something wrong? What I expect to see are four colour bands behind the chart!
{ "backgroundColor": "", "chartArea": { "backgroundColor": { "fill": "", "opacity": 0 }, "height": "75%", "width": "80%", "top": 60, "bottom": 40, "left": 50, "right": 20 }, "curveType": "", "hAxis": { "baselineColor": "#515F75", "format": 0, "gridlines": { "color": "#55657C" }, "minorGridlines": { "color": "#55657C" }, "maxValue": 50, "minValue": 0, "showTextEvery": 1, "textPosition": "out", "textStyle": { "fontName": "Cairo", "color": "#d9e2ee", "fontSize": 11.291839999999999 }, "ticks": "auto", "fontSize": 22, "title": "Age (Years)", "titleText": "Cairo", "titleColor": "#d9e2ee", "viewWindowMode": "explicit", "viewWindow": { "max": 50, "min": 0 } }, "isStacked": true, "legend": { "position": "top", "maxLines": "2", "alignment": "center", "pagingTextStyle": { "color": "#d9e2ee" }, "scrollArrows": { "activeColor": "#fff", "inactiveColor": "#828e9e" }, "textStyle": { "fontName": "Cairo", "color": "#d9e2ee", "fontSize": 11.291839999999999 } }, "lineWidth": 2, "pointSize": 1, "vAxis": { "baselineColor": "#515F75", "format": 0, "gridlines": { "color": "#55657C" }, "minorGridlines": { "color": "#55657C" }, "maxValue": "auto", "minValue": 1, "showTextEvery": 1, "textPosition": "out", "textStyle": { "fontName": "Cairo", "color": "#d9e2ee", "fontSize": 11.291839999999999 }, "fontName": "Cairo", "ticks": "auto", "title": "CR", "titleColor": "#d9e2ee", "viewWindowMode": "explicit", "viewWindow": { "max": 1, "min": 5 } }, "titleTextStyle": { "fontName": "Cairo", "fontSize": 11.291839999999999, "fontColor": "#d9e2ee", "color": "#d9e2ee" }, "series": { "0": { "color": "#0DAFBD" }, "1": { "lineWidth": 0, "color": "#71c94b", "type": "area", "visibleInLegend": false, "enableInteractivity": false, "pointShape": "none", "pointSize": 0, "pointsVisible": false }, "2": { "lineWidth": 0, "color": "#fabf20", "type": "area", "visibleInLegend": false, "enableInteractivity": false, "pointShape": "none", "pointSize": 0, "pointsVisible": false }, "3": { "lineWidth": 0, "color": "#F2203E", "type": "area", "visibleInLegend": false, "enableInteractivity": false, "pointShape": "none", "pointSize": 0, "pointsVisible": false }, "4": { "lineWidth": 0, "color": "#C40A3B", "type": "area", "visibleInLegend": false, "enableInteractivity": false, "pointShape": "none", "pointSize": 0, "pointsVisible": false } }, "width": "100%" }
Thanks for any help provided!
Greg Murdoch
1-2
2-3
3-4
4-5
My colour bars being set
0-1
1-2
2-3
3-4
The solution was to make sure the first band reference 0 instead of of 1, which turned my area / data into [2, 1, 1, 1], which now has the correct output.