timeout error when accessing Query to Google sheets
248 views
Skip to first unread message

Yves Puelings
May 13, 2022, 8:34:42 AM5/13/22
to Google Visualization API
Hi all, I'm pretty new to the integration of Chart and have been struggling to get my chart use an existing, publicly available Google sheet, as datasource. I've followed the instruction on https://developers.google.com/chart/interactive/docs/spreadsheets and my code looks like this
// Load the Visualization API and the corechart package.
google.charts.load('current', {'packages':['corechart']});
// Set a callback to run when the Google Visualization API is loaded.
google.charts.setOnLoadCallback(drawGID);
function drawGID() {
var query = new google.visualization.Query(
'https://docs.google.com/spreadsheets/d/1BxiMVs0XRA5nFMdKvBdBZjgmUUqptlbs74OgvE2upms/gviz/tq?sheet=Sheet1&headers=1&tq=SELECT%20A');
query.send(handleQueryResponse);
}
function handleQueryResponse(response) {
if (response.isError()) {
alert('Error in query: ' + response.getMessage() + ' ' + response.getDetailedMessage());
return;
}
var data = response.getDataTable();
...
running this, embedded in an html, in the browser gives me a 'timeout' message after 30 seconds, without further details. When I copy the URL directy in the browser address bar I get the desired JSON response. Any help or clarification would be highly appreciated. Regards.
Yves

Ray Thomas
May 14, 2022, 4:49:46 PM5/14/22
to Google Visualization API
Hello Yves,
var query = new google.visualization.Query(
query.send(handleQueryResponse);
}
function handleQueryResponse(response) {
if (response.isError()) {
alert('Error in query: ' + response.getMessage() + ' ' + response.getDetailedMessage());
return;
}
var data = response.getDataTable();
You have a couple of problems with this. The first is that the corechart package does not include the code to produce tables. You need to change
google.charts.load('current', {'packages':['corechart']});
to
google.charts.load('current', {'packages':['table']});
The other problem is because you are running this locally and you are encountering something called CORS. This is a very common mistake and see my answer at https://groups.google.com/u/2/g/google-visualization-api/c/Edh8HN3e-C0 as to what is happening and how to work around it while testing.
I use the GID version of the code you used rather than SHEETS, I just find it easier, and the code below works...
<script src="https://www.gstatic.com/charts/loader.js"></script>
<script>
google.charts.load('current', {'packages':['table']});
google.charts.setOnLoadCallback(drawGID);
function drawGID() {
var queryString = encodeURIComponent('SELECT A, B,C, D, E');
google.charts.load('current', {'packages':['table']});
google.charts.setOnLoadCallback(drawGID);
function drawGID() {
var queryString = encodeURIComponent('SELECT A, B,C, D, E');
var query = new google.visualization.Query(
'https://docs.google.com/spreadsheets/d/1BxiMVs0XRA5nFMdKvBdBZjgmUUqptlbs74OgvE2upms/gviz/tq?gid=0&headers=1&tq=' + queryString);
query.send(handleQueryResponse);
}
function handleQueryResponse(response) {
if (response.isError()) {
alert('Error in query: ' + response.getMessage() + ' ' + response.getDetailedMessage());
return;
}
var data = response.getDataTable();
var chart = new google.visualization.Table(document.getElementById('chart_div'));
chart.draw(data);
}
</script>
<div id="chart_div"></div>
chart.draw(data);
}
</script>
<div id="chart_div"></div>
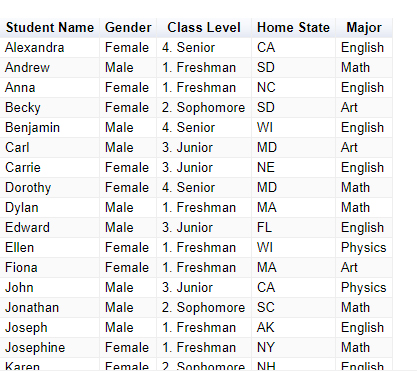
And this is what it produces...
Yves Puelings
May 17, 2022, 3:52:55 AM5/17/22
to Google Visualization API
Thanks for the help Ray. Solved my issues indeed.
Reply all
Reply to author
Forward
0 new messages