Help with code to lock the Total Row on Google Chart Table
887 views
Skip to first unread message

Noel
Jul 9, 2019, 8:07:36 PM7/9/19
to Google Visualization API
Hello Everyone,
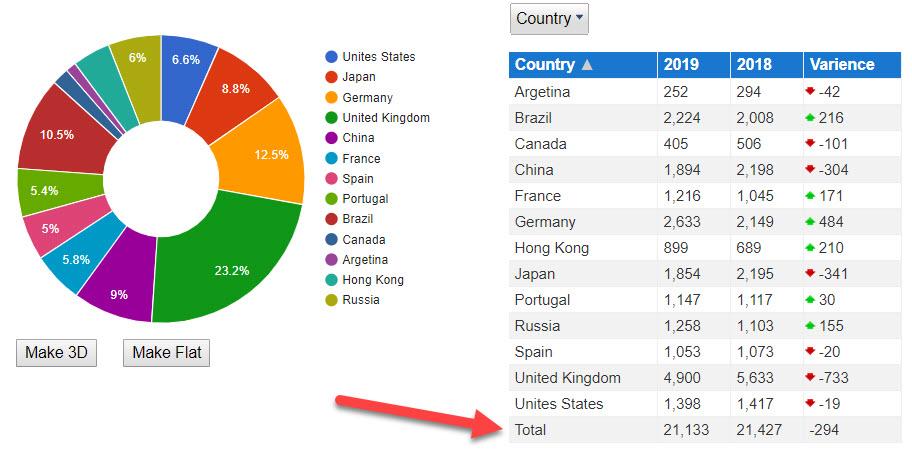
I've researched this many times and haven't found a way to lock the total row in a Google Chart Table, so that it does not get sorted and stays locked as the last row on my table.
Below is my current code for the chart and table. Thank you in advance for any advice.
Regards,
Noel
I've researched this many times and haven't found a way to lock the total row in a Google Chart Table, so that it does not get sorted and stays locked as the last row on my table.
Below is my current code for the chart and table. Thank you in advance for any advice.
Regards,
Noel
<!DOCTYPE html><html>
 <script type="text/javascript" src="//www.google.com/jsapi"></script>    <script type='text/javascript' src='http://code.jquery.com/jquery-2.1.0.min.js'></script>          <script type='text/javascript' src='//netdna.bootstrapcdn.com/bootstrap/3.0.3/js/bootstrap.min.js'></script>    <link rel="stylesheet" type="text/css" href="//netdna.bootstrapcdn.com/bootstrap/3.0.3/css/bootstrap.min.css">
      <script type="text/javascript" src="https://www.google.com/jsapi?fake=.js"></script>
  <style id="compiled-css" type="text/css">   .google-visualization-table-td {text-align: left !important;}
  .header {    background-color: #1977CF;    font-size: 14px;    color: white;    height: 50 px;    position: relative;  }
  .right-text {    text-align: left;  }
  .grey-background {    background-color: #F2F2F2;  }    .yellow-background {    background-color: #FEF200;  }    .white-background {    background-color: white;  }        </style>
  <!-- TODO: Missing CoffeeScript 2 -->
  <script type="text/javascript">

    google.load('visualization', '1.1', {packages: ['controls']});google.setOnLoadCallback(drawVisualization);
function drawVisualization() {    // Prepare the data    var data = google.visualization.arrayToDataTable([        ['Country', '2019', '2018','Varience'],['	Unites States	',	1398	,	1417	,	-19	],['	Japan	',	1854	,	2195	,	-341	],['	Germany	',	2633	,	2149	,	484	],['	United Kingdom	',	4900	,	5633	,	-733	],['	China	',	1894	,	2198	,	-304	],['	France	',	1216	,	1045	,	171	],['	Spain	',	1053	,	1073	,	-20	],['	Portugal	',	1147	,	1117	,	30	],['	Brazil	',	2224	,	2008	,	216	],['	Canada	',	405	,	506	,	-101	],['	Argetina	',	252	,	294	,	-42	],['	Hong Kong	',	899	,	689	,	210	],['	Russia	',	1258	,	1103	,	155	],

    ]);    // Define which column shows up/down arrows   var formatter = new google.visualization.ArrowFormat();    formatter.format(data, 3);
         // Define a category picker control for the Gender column    var categoryPicker = new google.visualization.ControlWrapper({        controlType: 'CategoryFilter',        containerId: 'control3',        options: {            filterColumnLabel: 'Country',            ui: {                label: '',                labelStacking: 'vertical',                allowTyping: false,                allowMultiple: true,                caption: 'Country'            }        }    });

var stringFilter = new google.visualization.ControlWrapper({          'controlType': 'StringFilter',          'containerId': 'control4',          'options': {          'filterColumnLabel': 'Services',          'ui': {'labelStacking': 'vertical'}          }        });
    // Define a Pie chart    var pie = new google.visualization.ChartWrapper({        chartType: 'PieChart',        containerId: 'chart1',        options: {            width: 430,            height: 300,            title: '',            //is3D: true,            pieHole: 0.4,            chartArea: {                left: 15,                top: 15,                right: 0,                bottom: 0            },              legend: {      alignment: 'center',      position: 'right'    },            pieSliceText: 'number'        },        // Instruct the piechart to use colums 0 (Name) and 3 (Donuts Eaten)        // from the 'data' DataTable.        view: {            columns: [0, 1]        }    });         // Define a table style     var cssClassNames = {        'headerRow': 'header',        'tableRow': '',        'oddTableRow': 'grey-background',        'selectedTableRow': '',        'hoverTableRow': 'yellow-background',        'headerCell': 'gold-border',        'tableCell': '',        'rowNumberCell': ''};
      // Define a table    var table = new google.visualization.ChartWrapper({        chartType: 'Table',        containerId: 'chart2',        options: {            width: '350px',            showRowNumber: false,            allowHtml: true,            cssClassNames: cssClassNames,        }    });                 google.visualization.events.addListener(pie, 'ready', function () {        var dt = pie.getDataTable().toDataTable();        var totals = google.visualization.data.group(dt, [{            type: 'number',            column: 0,            // make all values the same            modifier: function () {return 0;}        }], [{            type: 'number',            column: 1,            aggregation: google.visualization.data.sum        }, {            type: 'number',            column: 2,            aggregation: google.visualization.data.sum        }, {            type: 'number',            column: 3,            aggregation: google.visualization.data.sum        }]);        dt.addRow(['Total', totals.getValue(0, 1), totals.getValue(0, 2), totals.getValue(0, 3)]);        table.setDataTable(dt);        table.draw();    });            // Create a dashboard    new google.visualization.Dashboard(document.getElementById('dashboard')).    // Establish bindings, declaring the both the slider and the category    // picker will drive both charts.    bind([categoryPicker], [table, pie], [stringFilter, table]).
    // Draw the entire dashboard.    draw(data, {'allowHtml':true, 'cssClassNames': 'cssClassNames'});             changeOptions = function() {         pie.setOption('is3D', true);         pie.draw();        };                changeOptions2 = function() {         pie.setOption('is3D', false);         pie.draw();        };}

</script>
<body>    <div id="dashboard">    <table>        <tbody>            <tr style="vertical-align: top;">                <td style="width: 300px; font-size: 1em;">                      <div style="border: 0px solid #ccc; margin-left: 0px; margin-top: 0px; padding-right:20px" id="chart1"></div>                                 <div style="width: 100%; display: table;">    <div style="display: table-row">        <div style="width: 110px; display: table-cell;"> <div>              <button style="margin: 0em 1em 1em 1em" onclick="changeOptions();">                Make 3D              </button>            </div>            <script type="text/javascript">              function changeOptions() {                pie.setOption('is3D', true);                pie.draw();              }            </script> </div>        <div style="display: table-cell;"> <div>              <button onclick="changeOptions2();">                Make Flat              </button>            </div>            <script type="text/javascript">              function changeOptions2() {                pie.setOption('is3D', false);                pie.draw();              }            </script> </div>    </div></div>                                    </td>                <td style="width: 300px;">                    <div style="margin: 0em 10em 1em 0em" id="control3"></div>                    <div style="float: left;" id="chart2"></div>                 </td>             </tr>        </tbody>    </table></div>
  <script>    // tell the embed parent frame the height of the content    if (window.parent && window.parent.parent){      window.parent.parent.postMessage(["resultsFrame", {        height: document.body.getBoundingClientRect().height,        slug: "rEhUp"      }], "*")    }
    // always overwrite window.name, in case users try to set it manually    window.name = "result"  </script></body></html>

Shannon Whitty
Jul 9, 2019, 8:32:25 PM7/9/19
to Google Visualization API
This is how I achieved what you are trying to do.
After your `table.draw()` call - add the following jQuery to add a footer row to the already created table
        // Firstly here, we assign the table element to the variable mytable_foot
        // #chart2 is the div that you have attached and drawn your table to
        // table is the actual table that the chart API creates dynamically
        var mytable_foot = jQuery('<tfoot>').appendTo("#chart2 table");

    // Now we just append a row to the table using append()
    // Just need to make sure it has a <tr> wrapper and uses <th> not <td> for cells
    // Make sure the number of rows match the parent table - I use the google formatting classes to format the data
    // You can also add custom css by referencing: #chart2 table tfoot th {}
    mytable_foot.append('<tr>'+
          '<th class="google-visualization-table-td">Total</th>'+
          '<th class="google-visualization-table-type-number google-visualization-table-td">21,133</th>'+
          '<th class="google-visualization-table-type-number google-visualization-table-td">21,427</th>'+
          '<th class="google-visualization-table-type-number google-visualization-table-td">-294</th>'+
'</tr>');Noel
Jul 11, 2019, 6:27:01 PM7/11/19
to Google Visualization API
Thank you, Shannon! I appreciate your response and detailed code explanation. The only issue with this approach is the total amounts are static, but I need them to recalculate whenever I filter the table. Any suggestions on how to combine your append method and auto-summing the appended total row?
Regards,
Noel
Regards,
Noel
Shannon Whitty
Jul 11, 2019, 7:45:18 PM7/11/19
to Google Visualization API
You will need to use whatever language you built the site in to calculate totals when building the table data.
If they are static values, then you could use javascript but it would be a bit ugly e.g. https://www.youtube.com/watch?v=2p39swI3_Rs
Noel
Jul 14, 2019, 1:24:07 PM7/14/19
to Google Visualization API
Thanks, Shannon.
I'll see what I can do to make it work, although I'm still a coding novice.
Regards,
I'll see what I can do to make it work, although I'm still a coding novice.
Regards,
Noel
Reply all
Reply to author
Forward
0 new messages