Google Finance Charts - Percentage Change over different time frames missing. Alternatives?
298 views
Skip to first unread message

CB
Mar 26, 2018, 12:24:19 AM3/26/18
to Google Finance
Hello,
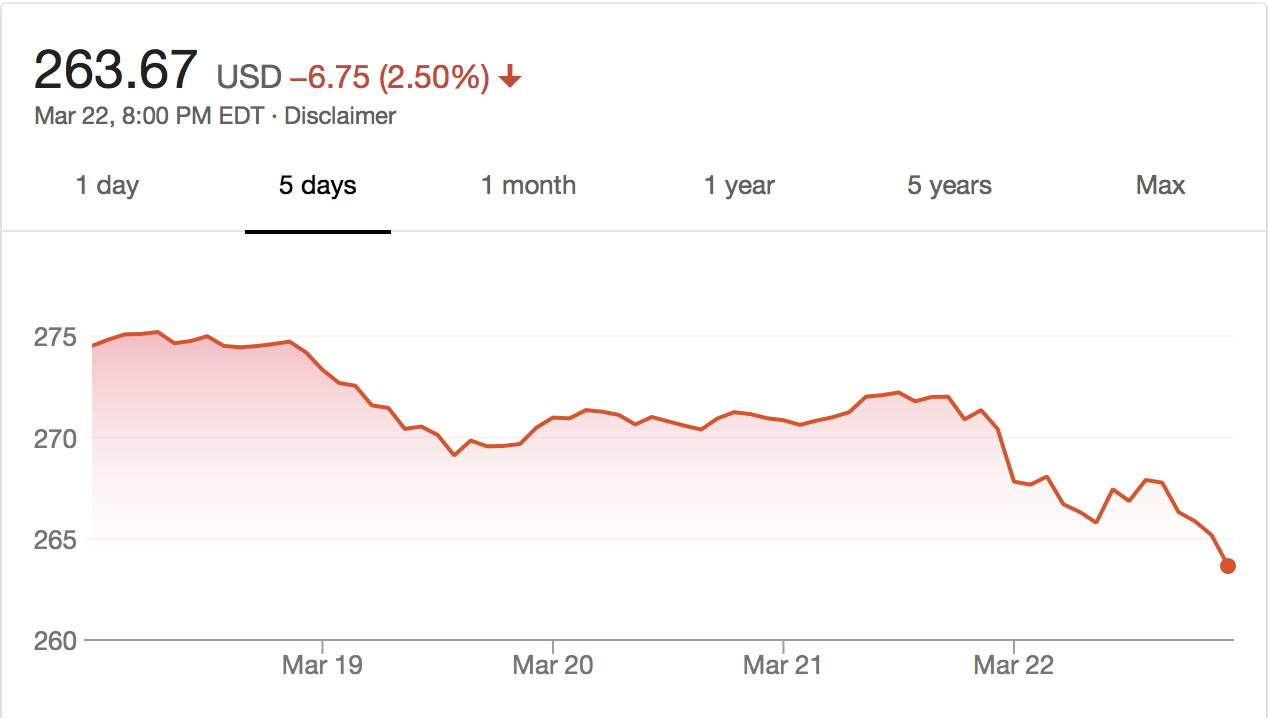
Much to my dismay, I noticed there were major changes made to Google Finance, including to the charting features. There used to be an option to select chart data history on stocks and other securities for 1 day, 5 days, 1 month, 3 months, 6 months, YTD, 1 yr, 5 yrs, and All. I noticed that the 3 month, 6 month and YTD options are now all gone.
Furthermore, the percentage change for each one of these periods used to be indicated, so if I wanted to see how much a stock had moved percentage-wise over 1 month, I could do so. Now, only the percentage change for 1 day is listed, regardless of the time frame I select. Does anyone know of an alternative site that will allow me to view the percentage changes for securities over different time frames alongside a graphical representation of the price change?
These features were very useful and convenient, and I'd like to be able to use them again.
Any help would be greatly appreciated. Thank you
CB
Mar 27, 2018, 12:32:07 AM3/27/18
to Google Finance
There has to be another site that offers charts with percent changes over custom time frames. I don't care if it's free or not, I will gladly pay for it. Does anyone know of any alternatives? Please, I beg you to help if you know. I will pay you directly if you offer an alternative

genericf...@gmail.com
Mar 29, 2018, 12:06:58 AM3/29/18
to Google Finance
I started using barcharts.com. It's not the same but it does give me a decent view and tools. I'm not affiliated with them. Just searching like you.
Reply all
Reply to author
Forward
0 new messages