Additional devTools panels from extension don't load in some conditions
90 views
Skip to first unread message

Erwan Laurent
May 27, 2020, 3:24:50 AM5/27/20
to Chrome DevTools
Hi, I manage an extension that adds several panels to classic devTools to inspect a remote target. Since the version 83 of Chrome, these additional panels don't load in certain conditions.
Our usual process is to open chrome://inspect/#devices then select the remote target to inspect, or click on "Open dedicated DevTools for Node". That opens a devTools with extension and so additional inspect/debug features.
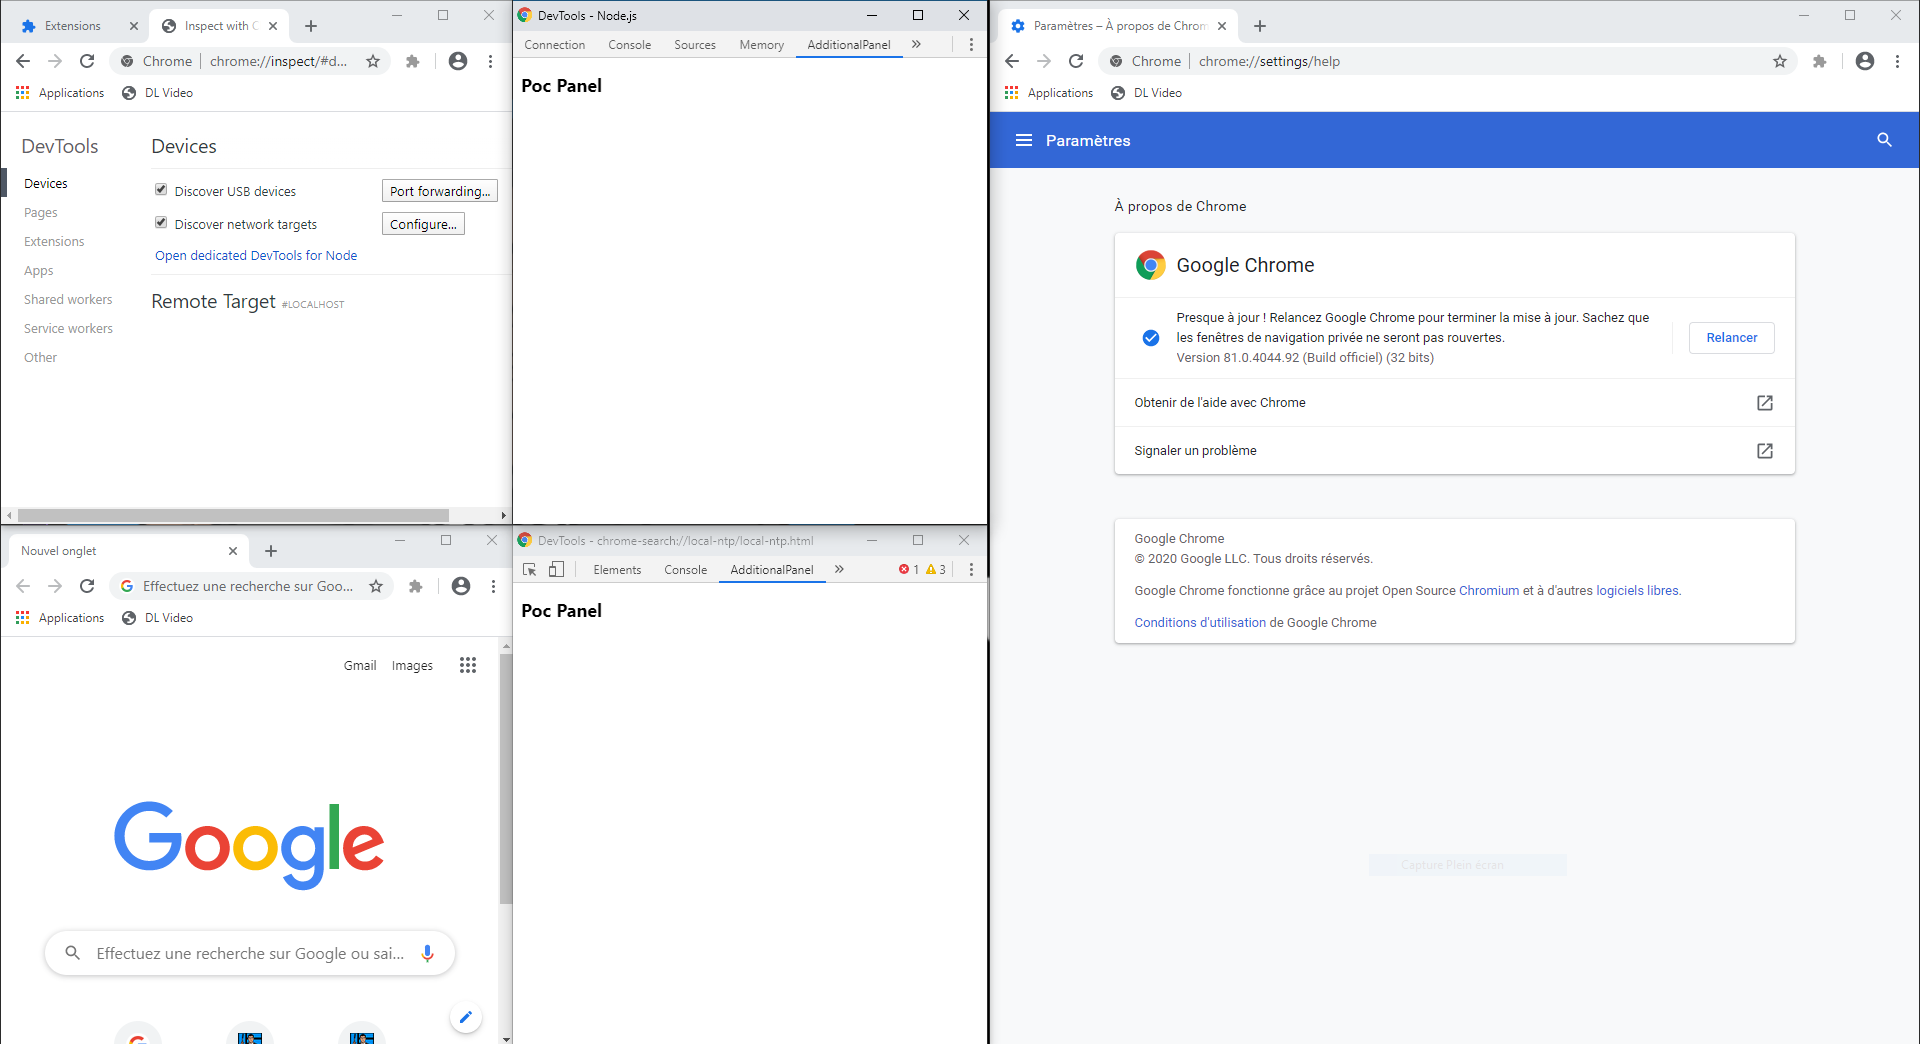
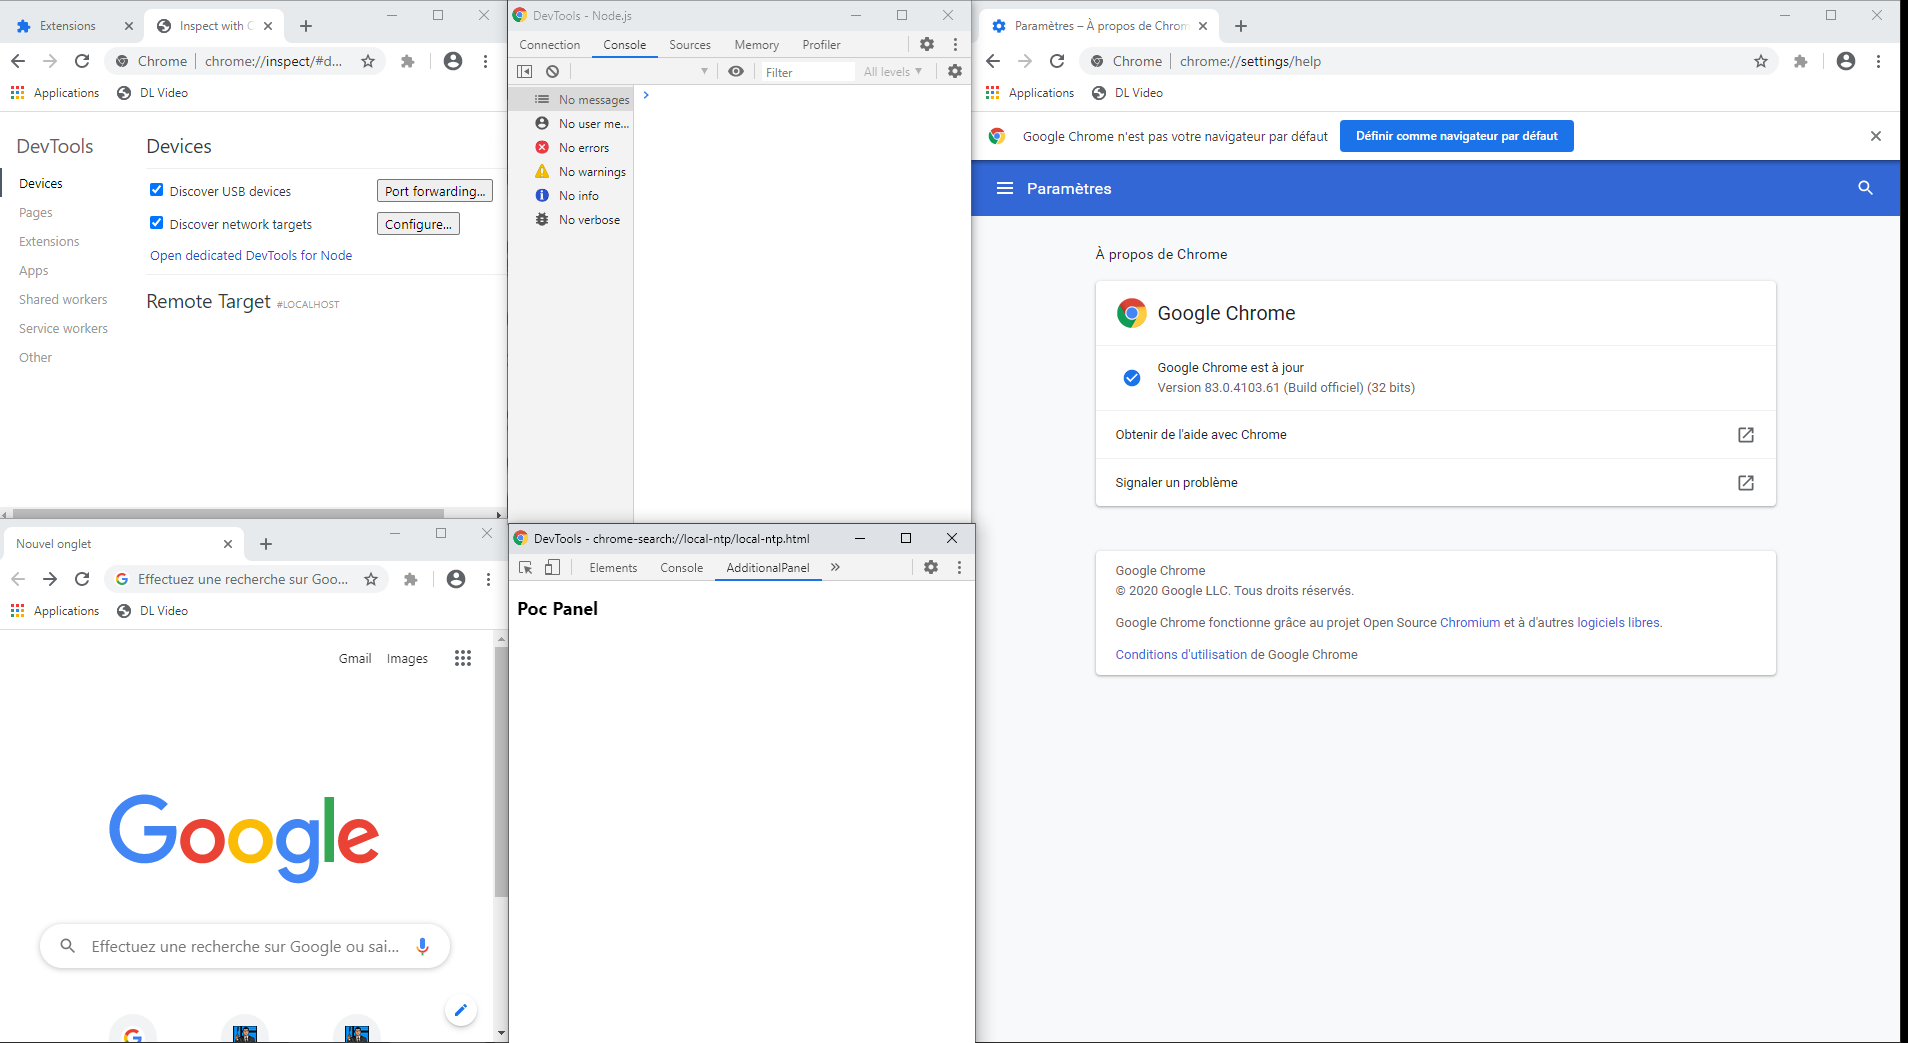
With chrome 83, we have to inspect the remote target to have the logs, then open devTools in any http page if we want to access our additional features but these are not loaded anymore in the devTools opened to inspect remote Node.
I've managed to create a minimalist extension where i reproduce the exact same issue, see https://github.com/Erwan-Laurent-Wiztivi/devToolsExtensionMin. That makes me think this issue is on Google Chrome side instead of our extension. It seems to be related to the protocol used : http or any equivalent webpage seems OK, but file:// protocol used when inspecting our remote target doesn't work anymore. I also tried several chrome:// page, they don't work anymore while chrome-search:// or chrome-extension:// are working (by working I mean additional panels are present when opening devTools).
Is it a security improvement I missed and can it be fixed on my side ? Is it a (known) issue on Google Chrome side ? If there is any missing info or a similar topic already opened (didn't find) please let me know.
See the issue in images : one for v81, one for v83, with on top the remote target and its devTools, on bottom chrome default page and its devTools. Notice the absence of >> for remote target to display other panels in v83 image

Yang Guo
May 27, 2020, 3:30:54 AM5/27/20
to Google Chrome Developer Tools, Andrey Kosyakov
Hi Andrey,
This seems to be a duplicate of crbug/1085228, WDYT?
Yang
--
You received this message because you are subscribed to the Google Groups "Chrome DevTools" group.
To unsubscribe from this group and stop receiving emails from it, send an email to google-chrome-develo...@googlegroups.com.
To view this discussion on the web visit https://groups.google.com/d/msgid/google-chrome-developer-tools/557b82b1-34cb-437f-9a9d-b7c343795915%40googlegroups.com.
Erwan Laurent
May 27, 2020, 9:21:12 AM5/27/20
to Chrome DevTools
Hi Yang, I just got the confirmation from your other post, I think you missed your link for Andrey :)
I can't access https://bugs.chromium.org/p/chromium/issues/detail?id=1085228 if that's the bug you refer to so I can't compare.
To unsubscribe from this group and stop receiving emails from it, send an email to google-chrome-developer-tools+unsub...@googlegroups.com.

Andrey Kosyakov
May 27, 2020, 10:56:32 PM5/27/20
to Google Chrome Developer Tools
Hi,
this is crbug.com/1085228 indeed -- sorry, this is an internally-filed bug that has some internal references, but the gist of it is that we started to disable the DevTools extensions on pages with the chrome: URL scheme because of the security concerns. The problem you seem to experience with nodejs seems to be a collateral damage of this change, apologies for that! We'll fix the node case, but as for attaching to other chrome: schemes, this is likely to remain so. Are there other use cases besides debugging node that you found to be impacted by this?
--
You received this message because you are subscribed to the Google Groups "Chrome DevTools" group.
To unsubscribe from this group and stop receiving emails from it, send an email to google-chrome-develo...@googlegroups.com.
Erwan Laurent
May 28, 2020, 3:51:24 AM5/28/20
to Chrome DevTools
Hi, I don't know if you count file:// use case for remote target as a Node one but besides these to use cases I didn't see another impact yet.
We'll fix the node case, but as for attaching to other chrome: schemes, this is likely to remain so
Glad to hear it and no issue about chrome: schemes, I talked about it to highlight differences I saw but we don't use devTools on these pages ;)
To unsubscribe from this group and stop receiving emails from it, send an email to google-chrome-developer-tools+unsub...@googlegroups.com.
Erwan Laurent
Jun 4, 2020, 4:35:01 AM6/4/20
to Chrome DevTools
Hi,
Andrey, do you know if we can expect a fix for this in next stable release of chrome ?
Erwan.
Reply all
Reply to author
Forward
0 new messages