What is the relationship between "DevTools-frontend" and "Catapult Trace-Viewer"?
346 views
Skip to first unread message
Tom Flanagan
Jun 9, 2020, 2:17:20 AM6/9/20
to Chrome DevTools
What is the relationship between "DevTools-frontend" and "Catapult Trace-Viewer"?
Devtools-Frontend: https://chromium.googlesource.com/devtools/devtools-frontend/
Catapult Trace-Viewer: https://chromium.googlesource.com/catapult/+/refs/heads/master/tracing/
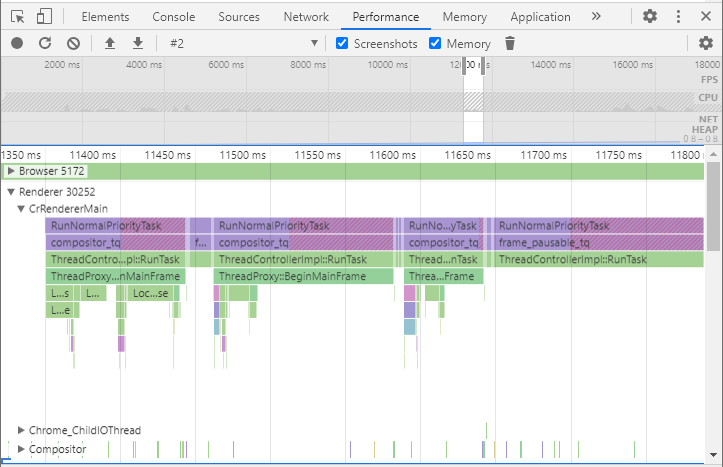
Both seem to include JS GUIs for viewing timeline data, and support recording, saving, and loading a very similar JSON format. (at least I can record a profile in chrome://tracing and load it in DevTools, but not the other way)
Both seem to have recent commits and be under active development.
Both are integrated into the Chrome browser (chrome://tracing, Dev Tools)
I am interested in using a GUI tool to display arbitrary timeline data,
(i.e, generated from a custom application, not to debug the Chrome browser). I can already save JSON (using this format) or ftrace logs and manually load it into chrome://tracing, however I'd like to be able to display it without the user having to do a "load" step and just from a link. It seems that two possible options are the trace2html tool in Catapult to generate a page with the trace data and viewer embedded,
or modify DevTools Timeline Viewer to load or embed some local data.
For displaying timelines, what are the differences between these projects and is there anything shared between them? Are their supported features & data formats documented anywhere?
Thanks,
Tom
Catapult:
DevTools:

Andrey Kosyakov
Jul 30, 2020, 2:45:56 PM7/30/20
to Google Chrome Developer Tools
Hi Tom,
there's no code shared between the two, they evolved independently historically, with slightly different goals. They share the same trace format nowadays, although historically the DevTools performance panel used a different instrumentation and a different format.
The DevTools front-end is specifically tailored to a subset of events emitted by chrome, and has a focus on representing the data in a way that is easy for a web developer to interpret, with plenty of support for the chrome- and devtools-specific entities.
The Catapult trace viewer is meant as a generic trace visualization tool, so it sounds like it would be a better match for your intended use.
Now there's actually a third option, which is perhaps the way to go if you're starting from scratch -- the Perfetto project is an effort to re-implement tracing, and uses a more efficient protobuf-based binary trace representation. Chrome currently uses perfetto internally and produces the JSON trace format for compatibility with older tools. Perfetto also includes a pretty neat and sophisticated standalone trace viewer.
Hope this helps.
Best regards,
Andrey.
--
You received this message because you are subscribed to the Google Groups "Chrome DevTools" group.
To unsubscribe from this group and stop receiving emails from it, send an email to google-chrome-develo...@googlegroups.com.
To view this discussion on the web visit https://groups.google.com/d/msgid/google-chrome-developer-tools/43d3c8df-41dc-4024-9ed9-b7110865dadao%40googlegroups.com.
Reply all
Reply to author
Forward
0 new messages
