Open response of a Ajax-POST in a new tab
501 views
Skip to first unread message

Thomas Güttler
Jan 10, 2021, 5:38:30 AM1/10/21
to Chrome DevTools
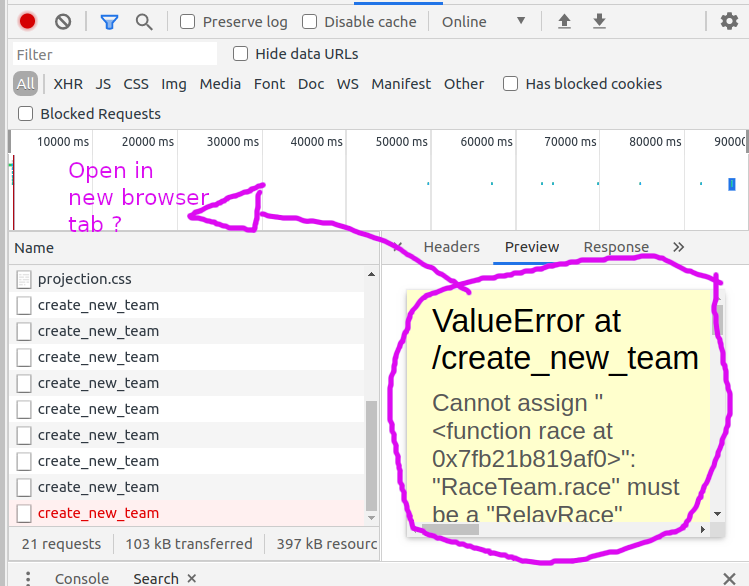
If an ajax/fetch request fails, my framework (django) displays a nice debug page, which contains a lot of useful information.
In chrome devtools I can see a preview of this debug page. But the window in the devtools is way too small.
Is there a way to open the output of the POST request in a new tab?
If I use right-button-click "open in new tab" then chrome does a GET. But the GET does not trigger the exception which I would like to debug.
Related question at Stackoverflow: https://stackoverflow.com/questions/65570252/devtools-open-response-html-in-new-tab
I could use Postman with a chrome-plugin, but somehow I would like to
know if there is an alternative solution.

guest271314
Jan 10, 2021, 9:23:41 AM1/10/21
to google-chrome-...@googlegroups.com
Given a Response with 'ok' set to false and 'status' set to 301, e.g.,
let r = new Response(1, {
cache:'no-store'
, redirect:'follow'
, status: 301
, body:'<h1>response</h1>'
});
let w;
let w;
if (r.status === 301 && !r.ok) {
w = window.open(URL.createObjectURL(await r.blob()))
}
w = window.open(URL.createObjectURL(await r.blob()))
}
// w.close();
--
You received this message because you are subscribed to the Google Groups "Chrome DevTools" group.
To unsubscribe from this group and stop receiving emails from it, send an email to google-chrome-develo...@googlegroups.com.
To view this discussion on the web visit https://groups.google.com/d/msgid/google-chrome-developer-tools/9c51ff1c-d74b-42c9-b2a6-b4c8f03f9f35n%40googlegroups.com.
guest271314
Jan 10, 2021, 9:35:35 AM1/10/21
to Chrome DevTools
Using write()
Where r is
let r = await fetch('/path/to/resource');
let w;
if (r.status === 301 && !r.ok) {
w = window.open(URL.createObjectURL(new Blob()), '_blank');
w.document.write(await r.text());
} else {
// do other stuff
}
// do other stuff
}
Thomas Güttler
Jan 12, 2021, 8:03:18 AM1/12/21
to Chrome DevTools
Thank you for your replies,
since this is not a simple GET request, I want to re-submit the post request, which I see
in the network tab of devtools.
How to send the same request again?
Regards,
Thomas
guest271314
Jan 12, 2021, 6:53:11 PM1/12/21
to Chrome DevTools
I am not certain what you are trying to achieve.
You can clone() a Request() or Response(). You can read the Response.body if not "disturbed" or locked to a reader and create a new request or response from the underlying source.
You can also utilize catch() to handle Error returned from fetch().then() if a response does not throw an error can be thrown for specific status or URL, and PerformanceObserver to check requests locally, or if you have control over the page, ServiceWorker handle the request.
Thomas Güttler
Jan 14, 2021, 4:37:18 AM1/14/21
to Chrome DevTools
thank you for asking, now I know better what I want.
I want a GUI. I would like to re-submit the post via clicking. This works for GET,
but it would be great if it would work for POST, too.
Reply all
Reply to author
Forward
0 new messages