[Chrome DevTools] Understanding detached DOM tree
4,981 views
Skip to first unread message

Ilya Tikhonovsky
May 15, 2014, 2:17:12 AM5/15/14
to google-chrome-...@googlegroups.com
Each dom tree has a few nodes in it. These nodes are native c++ objects in the generic heap. Some of them may have DOM wrappers in JS heap. I.e. if you are accessing a node from js the node will have the wrapper object in JS heap. Profiler shows to you the information about nodes count in the title of the Detached DOM Tree item and attaches corresponding wrappers as the children. So the number of these wrappers will be equal or less than the number in the title just because not all the nodes in the detached DOM tree has been accessed from js code.


The picture which describes the idea 
Different object ids mean different objects.
Usually when you are looking for a reason of the leak you would like to see the retainers of an object and then retainers of retainers, etc. So when you select an object, profiler shows you the list of direct retainers in the Retainers tree window, sort them by distance and expand the first elements on each level. As a result the expanded part of the Retainers tree is the shortest path to window object.
On Thu May 15 2014 at 5:56:02 AM, Buddhike de Silva <buddhike...@geeksdiary.com> wrote:
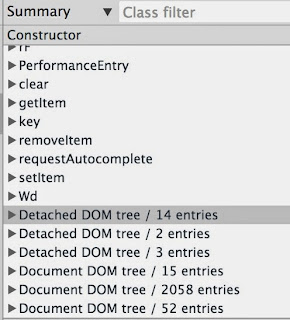
I'm trying to understand how to analyse a detached dom tree in Chrome developer tools.--I have a few things to clarify. I'm going to use this page as an example: https://developer.chrome.com/devtools/docs/demos/memory/example4This is the summary view I get when I load the page for the first time take a heap snapshot.
First question, what does "14 entries" mean on the highlighted line? The number does not seem to represent the number of items you see when you expand that node.I initially thought each Detached DOM tree line represents root of each detached item. But sometimes when I expand it, it has more Detached DOM tree nodes as shown below.
So my second question is what does that relationship mean?Now that I've taken the first heap snapshot, I clicked on "Create detached nodes" button on the page and took another snapshot. After that I get a list of detached dom trees like this.
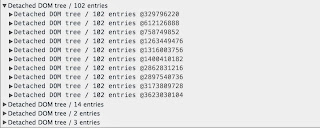
My next goal is to find JS references to detached node(s). I clicked on the item which says 102 entries (although I'm not sure what that number means). And I see more detached DOM tree nodes. When I expand each one of them, somewhere in the list of elements I see the fragment element causing the issue (see screenshot below). It's highlighted in yellow and when I click on it, I can see "frags" property on Window object in "Object" pane below.
That's great. But if I expand any other Detached DOM tree nodes with 102 entries, I could see the same item. Only difference is they are in a different position in that array and they seem to have different object ids. What does that mean?Is there an easy way to figure out which list to explore if I'm looking for an element with references?Lastly, as you can see, "Retainers" pane is empty. Should I see window.frags there in this scenario?Thanks heaps in advance for any pointers.
You received this message because you are subscribed to the Google Groups "Google Chrome Developer Tools" group.
To unsubscribe from this group and stop receiving emails from it, send an email to google-chrome-develo...@googlegroups.com.
To view this discussion on the web visit https://groups.google.com/d/msgid/google-chrome-developer-tools/ead0ab61-34c0-4e98-81e1-75232755a096%40googlegroups.com.
For more options, visit https://groups.google.com/d/optout.


Reply all
Reply to author
Forward
0 new messages