Network tab display socket used for request
3,739 views
Skip to first unread message

Chase
Sep 26, 2017, 3:01:55 AM9/26/17
to Google Chrome Developer Tools
Feature request
This is a feature request for functionality within the network tab of devtools. I would like network tab to display the local socket that was opened for a request.
As a network engineer, I am having to rely more and more on Chrome dev tools to understand the resources that people are loading to see why pages aren't loading correctly. Devtools is great because I can easily cross-reference domains to the IP address that's being used instead of guessing which IP got used after the DNS request. However, sometimes I still have trouble narrowing down which TCP request went over a particular socket. By having the socket displayed I would be able to easily take a packet capture upstream of the computer to see where in the network the connection is dropping.
If the webpage is simple and only one TCP socket is opened then it's easy to guess which socket is being used. However, on pages that load multiple resources from several different places, it can quickly become overwhelming.
Here's an example of my current process to finding the socket right now. For the sake of simplicity, I am going to troubleshoot a very simple site - www.example.com. Sorry for the large screenshots, I couldn't see any of the info if the size was changed.
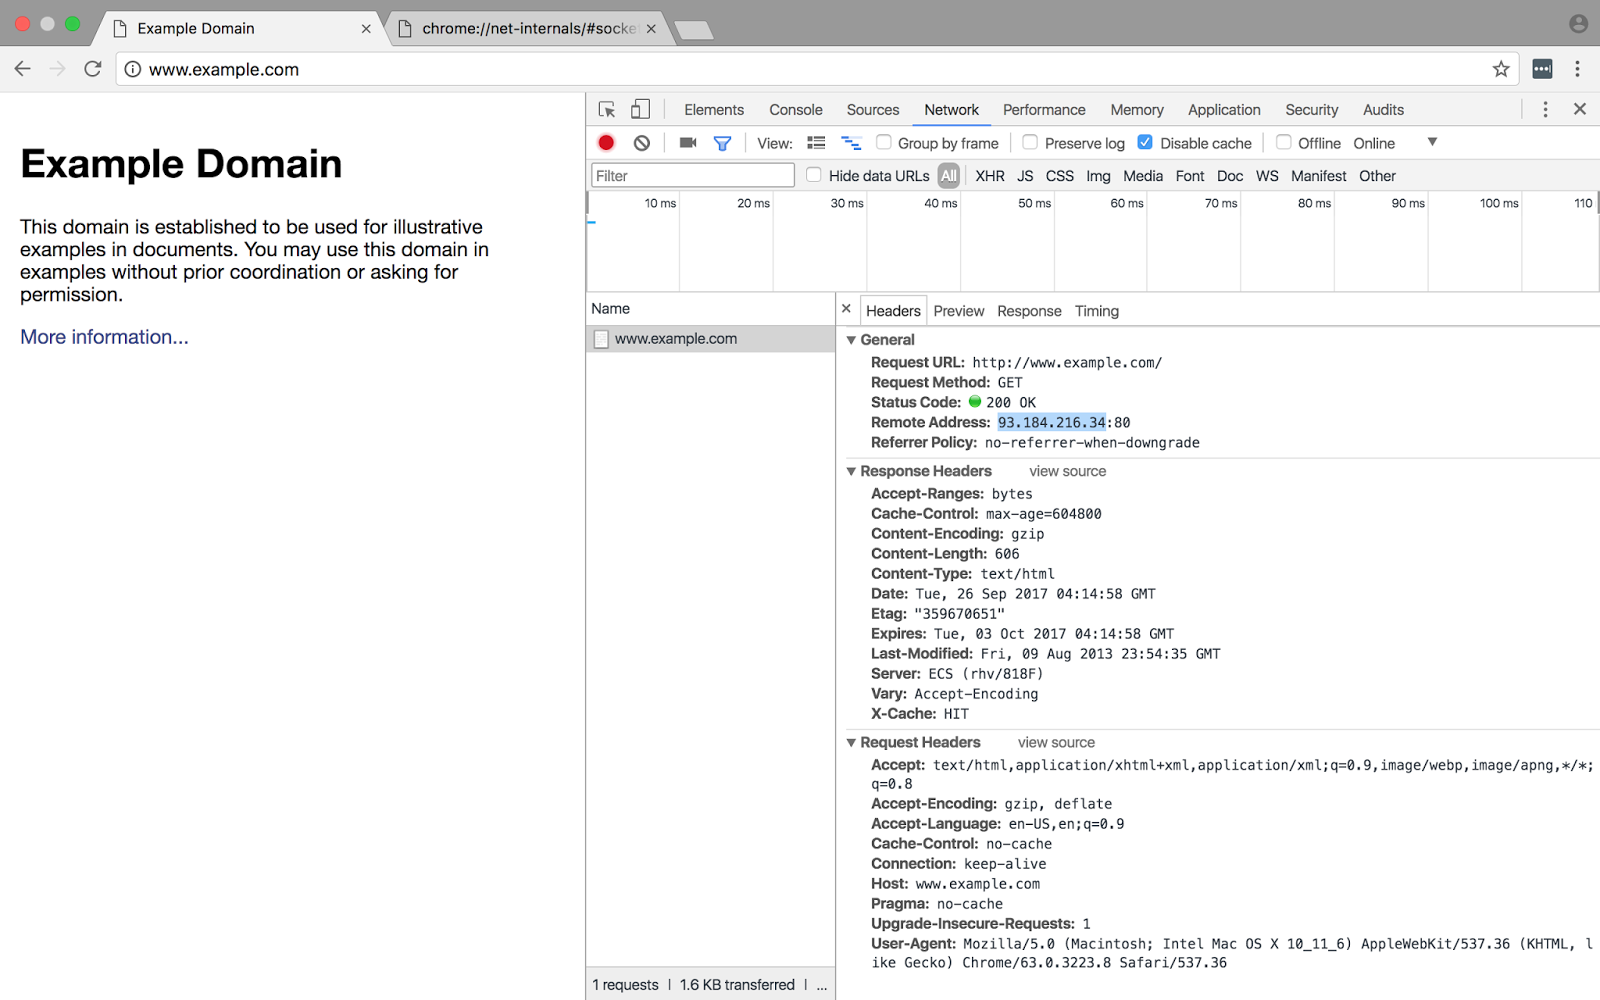
1) As you can see here I've opened example.com and 93.184.216.34 is the IP address of the server.
2) In order to find the correct socket, I need to go to chrome://net-internals/#sockets where I can see the idle socket for example.com:80.
3) Clicking on the socket, I can see the socket that's been opened for this TCP connection 65153.

4) I can now take 65153 and use that in wireshark to filter for the exact web request that I need to find.

If the socket were displayed in the first screenshot then it would be much more simple to filter right away.
Since everyone loves to blame the network, it would be great to have a way to track down where the problem is faster.

PhistucK
Sep 26, 2017, 3:04:05 AM9/26/17
to Google Chrome Developer Tools
Right click on the column titles of the network panel and select Connection ID. Might that be what you need?
☆PhistucK
--
You received this message because you are subscribed to the Google Groups "Google Chrome Developer Tools" group.
To unsubscribe from this group and stop receiving emails from it, send an email to google-chrome-developer-tools+unsub...@googlegroups.com.
To view this discussion on the web visit https://groups.google.com/d/msgid/google-chrome-developer-tools/781486ff-7ad0-48f8-a7f0-9f0a9c6bd165%40googlegroups.com.
For more options, visit https://groups.google.com/d/optout.
Chase
Sep 26, 2017, 4:19:36 AM9/26/17
to Google Chrome Developer Tools
It does make finding the correct socket much easier! Initially, I was hoping that it could be incorporated into one integrated view. But now that I know how to draw a direct correlation between the two, I am good to go!
Just noting for others, it does require that chrome://net-internals be open before the page loads. In the event section search for "id:####" where #### is the connection id. This will show you socket. Now you can search for the socket number in wireshark.
Thank you!
Reply all
Reply to author
Forward
0 new messages