Dual Y Axes Line Chart Axes Titles not displaying
82 views
Skip to first unread message

graham...@hotmail.co.nz
Jul 19, 2021, 7:48:44 PM7/19/21
to Google Chart API
Hi,
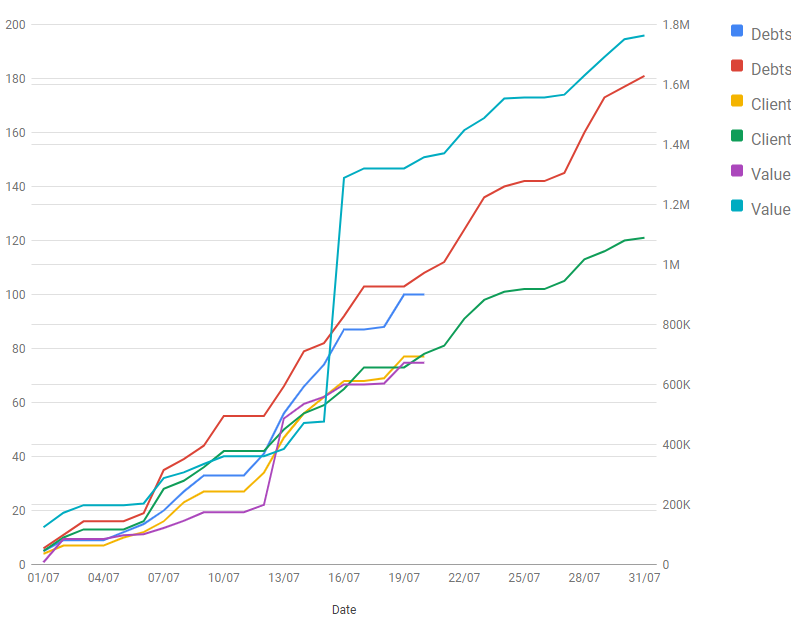
I have a dual axes multi series line chart working almost 100% my problem is the Y Axes titles are not displaying. Can anyone hep. Here is my code
// Load Charts and the corechart package.
google.charts.load('current', {'packages':['table', 'corechart', 'line']});
//Do Debt Load Line Graph
google.charts.setOnLoadCallback(draw_Debt_Load_Chart)
// Debt Load Chart
function draw_Debt_Load_Chart() {
var Debt_Load_Chart_data = new google.visualization.DataTable();
Debt_Load_Chart_data.addColumn('string', 'Day');
Debt_Load_Chart_data.addColumn('number', 'Debts This Month');
Debt_Load_Chart_data.addColumn('number', 'Debts This Month Last Year');
Debt_Load_Chart_data.addColumn('number', 'Clients This Month');
Debt_Load_Chart_data.addColumn('number', 'Clients This Month Last Year');
Debt_Load_Chart_data.addColumn('number', 'Value Loaded This Month');
Debt_Load_Chart_data.addColumn('number', 'Value Loaded This Month Last Year');
Debt_Load_Chart_data.addRows([
['01/07',5,6,4,5,7483,124262],
['02/07',9,11,7,10,84939,172525],
['03/07',9,16,7,13,84939,197849],
['04/07',9,16,7,13,84939,197849],
['05/07',12,16,10,13,97826,197849],
['06/07',15,19,12,16,100796,203467],
['07/07',20,35,16,28,121555,287887],
['08/07',27,39,23,31,145583,307183],
['09/07',33,44,27,36,174287,334919],
['10/07',33,55,27,42,174287,360722],
['11/07',33,55,27,42,174287,360722],
['12/07',41,55,34,42,198884,360722],
['13/07',56,66,47,50,486547,385170],
['14/07',66,79,56,56,535544,471854],
['15/07',74,82,62,59,558845,476676],
['16/07',87,92,68,65,600212,1288508],
['17/07',87,103,68,73,600212,1320347],
['18/07',88,103,69,73,603646,1320347],
['19/07',100,103,77,73,672120,1320347],
['20/07',100,108,77,78,672120,1357803],
['21/07',null,112,null,81,null,1370514],
['22/07',null,124,null,91,null,1447544],
['23/07',null,136,null,98,null,1488082],
['24/07',null,140,null,101,null,1553539],
['25/07',null,142,null,102,null,1556666],
['26/07',null,142,null,102,null,1556666],
['27/07',null,145,null,105,null,1566126],
['28/07',null,160,null,113,null,1629722],
['29/07',null,173,null,116,null,1691903],
['30/07',null,177,null,120,null,1751113],
['31/07',null,181,null,121,null,1763487]
]);
var Debt_Load_Chart_options = {
chart: {
title: ''
},
titleTextStyle: {color: 'black', fontName: 'Arial', bold: true, fontSize: 12},
series: {
0: {axis: 'Number'},
1: {axis: 'Number'},
2: {axis: 'Number'},
3: {axis: 'Number'},
4: {axis: 'Dollars'},
5: {axis: 'Dollars'}
},
axes: {
// Adds labels to each axis; they don't have to match the axis names.
vAxes: {
Number: {label: 'Number Loaded'},
Dollars: {label: 'Value Loaded'}
}
},
hAxis: {title: 'Date'}
};
var Debt_Load_Chart = new google.charts.Line(document.getElementById('Debt_Load_linechart'));
Debt_Load_Chart.draw(Debt_Load_Chart_data, google.charts.Line.convertOptions(Debt_Load_Chart_options));
}
Reply all
Reply to author
Forward
0 new messages