Create Graph on Docs with Sheet data (HELP!)
412 views
Skip to first unread message

Diana Ramos Fusther Correa
Jan 30, 2023, 10:55:08 AM1/30/23
to Google Apps Script Community
Hi everyone!
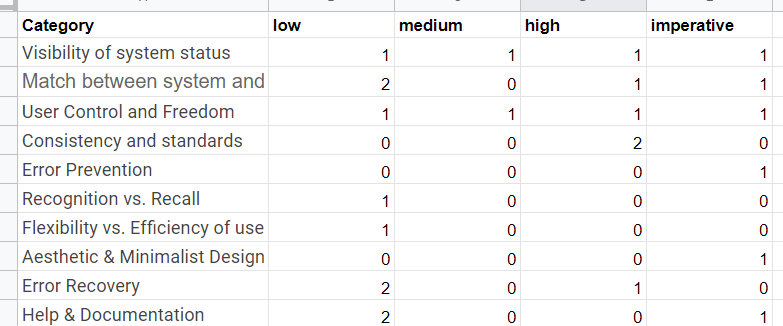
I have this data on a table in my Google Sheets that I want to convert to a bar graph and paste it in a specific part of a report template.
Does anyone know how to go about? or have resources where I can read about it?
I tried searching for tutorials in youtube, but couldn't find anything for copying charts into google docs or creating said charts inside google docs.
Table with data IN GOOGLE SHEETS
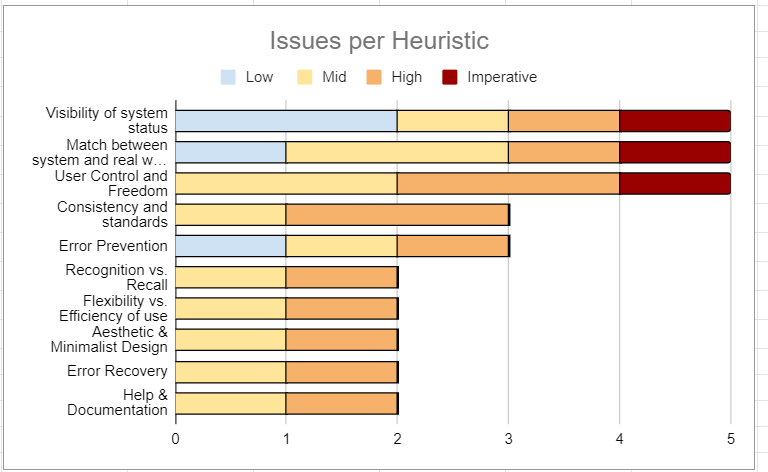
Desired output IN GOOGLE DOCS

Halicate
Jan 30, 2023, 2:07:59 PM1/30/23
to Google Apps Script Community
Of course you can!
Here, you have a dummy sheet with a graph more or less as the one you want. You can do something similar and, then, you can click in the graph, go to the three point on the top right corner an click Copy.
After than, open your Doc and paste it. And the best thing is that it will ask you if you wnat to link Doc and Graph, and each time you change your data, of course that the graph in the sheet will change but, even more, when you open the Doc, you would click Update and change the Graph too.
Try and enjoy it!
Diana Ramos Fusther Correa
Jan 31, 2023, 5:07:52 PM1/31/23
to Google Apps Script Community
Hmm yeah I know about that, but the thing is this is for an automated report. So the data and the graph are generated via a Script from a report database of tickets with categories and priorities. It's a final data from another source, so there is no need to update it here.
What I need, rather than a manual copy-paste, is a way to copy-paste this graph via App Scripts from the google sheet to the generated report draft in google docs
Halicate
Feb 1, 2023, 12:20:23 AM2/1/23
to Google Apps Script Community
Ok, sorry... perhaps something more like this, inserting an image chart
Code:
function GraphEx() {
//From Graph to Image
var ss = SpreadsheetApp.openById("1U9_306C0oQoho6AgNM3yxJNvXKpmaPpeMuY76tBOUPs");
var sheet = ss.getSheetByName("DataGraph");
var myChart = sheet.getCharts()[0];
var myChartBlob = myChart.getAs('image/png').copyBlob();
//Inserting Image
const templateDoc = DriveApp.getFileById("1oszFG-YqlV-KReFppBiSE0Ga1vhntTiD7WegEjVqd50");
const newTempFile = templateDoc.makeCopy();
const openDoc = DocumentApp.openById(newTempFile.getId());
const body = openDoc.getBody();
body.replaceText( "Inserted Graph}","");
body.insertImage(1,myChartBlob);
}
Reply all
Reply to author
Forward
0 new messages