
Optimizing Modules for CPU Utilization & Memory Usage
450 views
Skip to first unread message

Derek Perkins
Jun 1, 2015, 11:16:42 AM6/1/15
to google-ap...@googlegroups.com
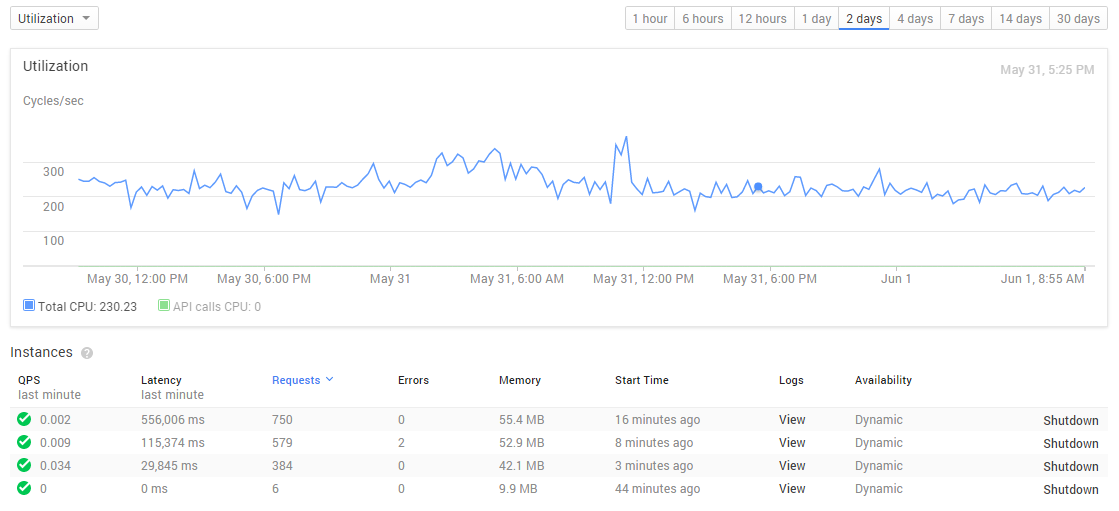
I'm trying to determine the right settings for my instance sizes and how many concurrent requests they can manage. I've copied my usage graphs from the developer console, and you can see that my usage is fairly consistent: it's running 4 instances that each use about 60MB RAM, and I'm assuming that the Cycles/sec are also combined across my instances, meaning I'm using 60-75 cycles/sec/instance. These instances are all maxed out at F4_1G for the time being (see below for complete app.yaml)
Memory usage is pretty obvious in this case, the same 4 instances should easily fit onto 4 F1 boxes with plenty of room to spare, or I could let each instance serve 400 concurrent requests and fit into a single F2. What's not obvious to me is how CPU utilization fits into that picture. How many cycles/sec can I expect to get out of each instance size without impacting performance? This is my most consistent use case, so I'm hoping to extrapolate this to all of my other modules that see more spikes in their traffic.

runtime: goapi_version: go1instance_class: F4_1Gautomatic_scaling: min_idle_instances: 0 max_idle_instances: 1 max_concurrent_requests: 100 min_pending_latency: 15s max_pending_latency: 15s
Andrew Greene
Jun 1, 2015, 12:04:36 PM6/1/15
to google-ap...@googlegroups.com
I'm interested in this question too.
Derek Perkins
Jun 2, 2015, 12:16:28 AM6/2/15
to google-ap...@googlegroups.com
I've found a little bit more documentation, but it still leaves me confused.
For example, if a B4 instance (approx 2.4GHz) consumes 10 Mcycles/request, you can process 240 requests/second/instance. If it consumes 100 Mcycles/request, you can process 24 requests/second/instance, etc. These numbers are the ideal case but are fairly realistic in terms of what you can accomplish on an instance.
If the chart is in Cycles/sec as it claims to be, then each instance that was 60 cycles / sec equals out to .00006 Megacycles per second. With those numbers, 2.4 Ghz / .00006 Megacycles/sec * 1000 = 40,000,000, that seems way out of the ballpark. I know my Mcycles / sec is a different number than their per request number, so my math isn't great. It just doesn't feel like it adds up. It feels like it may just be mislabeled, but it'd be nice to know.
I found some other info by David Symonds here in response to a question on "runtime mcycles" and "cpu_ms" accounting on AppEngine's Go runtime.
The cpu_ms and related accounting measures are legacy holdovers from
the old billing structure, which was based at least partly on CPU
consumption. Nowadays it is meaningless from that perspective, and I
wouldn't be surprised if those numbers are somewhat nonsensical.
There's nothing in the Go runtime done to attribute CPU time to
separate requests, nor is it really tractable to do so in a concurrent
runtime. The attributing is statistical in nature, which may account
for the weirdness you are seeing.
I'd love to get some official feedback from the App Engine Googlers.
Reply all
Reply to author
Forward
0 new messages