date on the x axis
Skoðað 17 sinnum
Fara í fyrstu ólesnu skilaboð

lazar...@gmail.com
11. okt. 2021, 04:20:5611.10.2021
til gonum-dev
Hi. please tell me how to make a date on the X axis, because the type is plotter.xyz float64. As an example, I took this code https://github.com/gonum/plot/wiki/Example-plots#horizontal

Sebastien Binet
11. okt. 2021, 04:39:5811.10.2021
til lazar...@gmail.com,gonum-dev
hi,
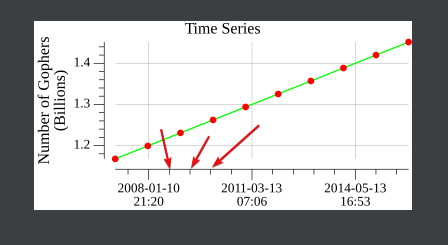
here's an example of a time-series:
- https://pkg.go.dev/gonum.org/v1/pl...@v0.10.0/plotter#example-package-TimeSeries
would that work for you?
-s
- https://pkg.go.dev/gonum.org/v1/pl...@v0.10.0/plotter#example-package-TimeSeries
would that work for you?
-s
lazar...@gmail.com
11. okt. 2021, 04:57:3211.10.2021
til gonum-dev
Yes, that's what I need, thank you
понедельник, 11 октября 2021 г. в 11:39:58 UTC+3, Sebastien Binet:
lazar...@gmail.com
11. okt. 2021, 05:04:3211.10.2021
til gonum-dev
Sebastien Binet
11. okt. 2021, 05:25:3911.10.2021
til lazar...@gmail.com,gonum-dev
you need to mark it as a "major" tick:
- https://pkg.go.dev/gonum.org/v1/plot#Tick.IsMinor
basically, creating a plot.Tick value with a non-empty 'Label' field.
I guess that if you have an explicit list of desired ticks (ie: points
in time) you want to render, an option is to use a combination of
plot.ConstantTicks and plot.TimeTicks:
- https://pkg.go.dev/gonum.org/v1/plot#ConstantTicks
ie: use the ConstantTicks as the Ticker field of plot.TimeTicks, where
ConstantTicks is the list of points in time you want to render.
timeTicks := plot.TimeTicks{
Ticker: plot.ConstantTicks([]plot.Tick{
timePt1, timePt2, ...
}),
Format: "some format",
}
hope that helps,
-s
lazar...@gmail.com
11. okt. 2021, 06:07:3511.10.2021
til gonum-dev
thanks for the help
понедельник, 11 октября 2021 г. в 12:25:39 UTC+3, Sebastien Binet:
Svara öllum
Svara höfundi
Senda áfram
0 ný skilaboð