axis range for charts
28 views
Skip to first unread message

Michael Rieder
May 2, 2023, 4:04:38 AM5/2/23
to golden-cheetah-users
Hi Guys
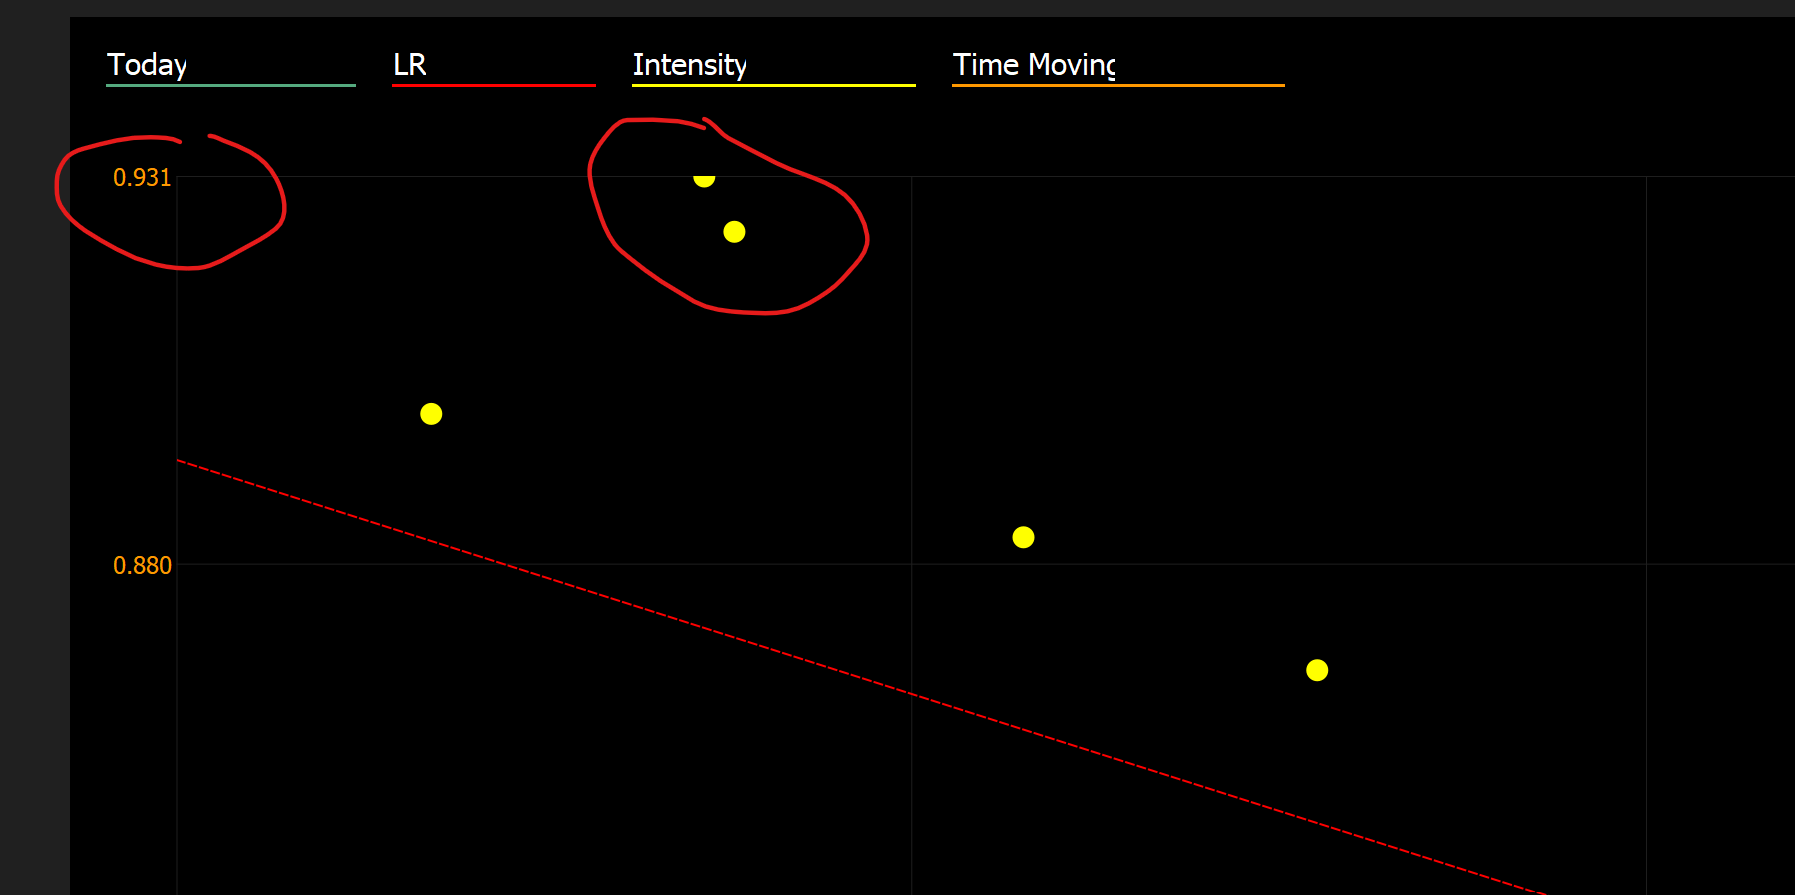
There are two possibilities setting the beginning and the end of the axis range for new user charts.
Either let GC set the range automatically or set the range manually as fix values.
In the automatic mode all values (min, max) at the edges are not displayed in full. Would it by possible th set the range *0,9 for the min and *1,1 for the max?
Reply all
Reply to author
Forward
0 new messages