DEVELOPMENT BUILD JANUARY 2021
873 views
Skip to first unread message

Mark Liversedge
Jan 5, 2021, 11:34:26 AM1/5/21
to golden-cheetah-users
Please post any issues with this build here.
Thanks
Mark

rmcbeath
Jan 7, 2021, 6:51:49 PM1/7/21
to golden-cheetah-users
Mark, prior to running the January 2021 build, should I have uninstalled previous installations of Python or R?
I had installed Python 3.6.4 a year or so ago before it was built into the GC installer along with a many of the modules (numpy, pandas, scipy, scikit learn, tensorflow, lmfit, colour, plotly) that were necessary for many of the charts.
The January 2021 build seems to be running properly, but I have tried some of the curated charts and only see blank screens while other charts are running fine.
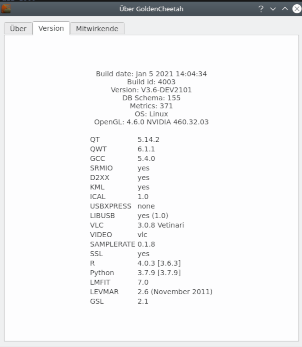
When I click on the "Help" Menu in Golden Cheetah, then "About Golden Cheetah", then "Version" Tab, I see:
R 3.5.2 [4.0.3]
Python 3.7.7 [3.7.9]
When I enter "python --version" in the Windows Command Prompt, I get: Python 3.6.4
When I go into the Windows Settings / Apps & features, I see:
Python 3.6.4 (64-bit) Date 5-27-2020
Python Launcher Date 1-12-2020
R for Windows 3.5.2 Date 1-14-2020
Thanks,
Randy

marcen
Jan 8, 2021, 2:50:38 AM1/8/21
to golden-cheetah-users
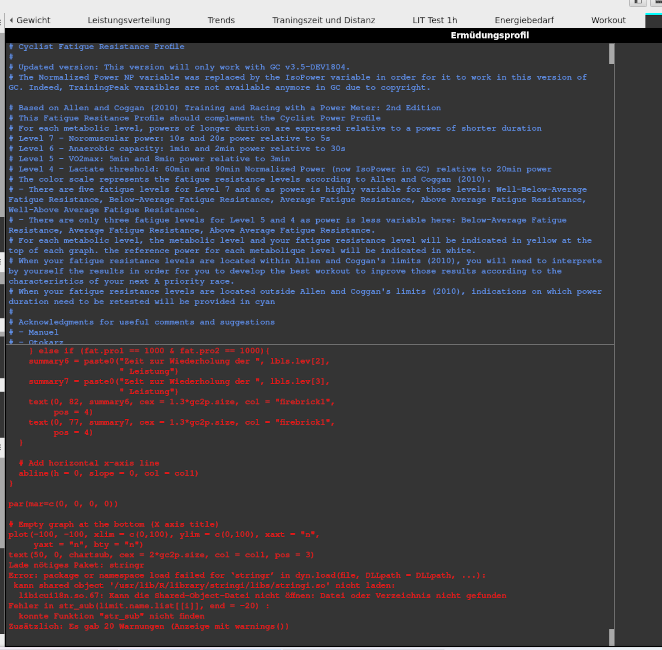
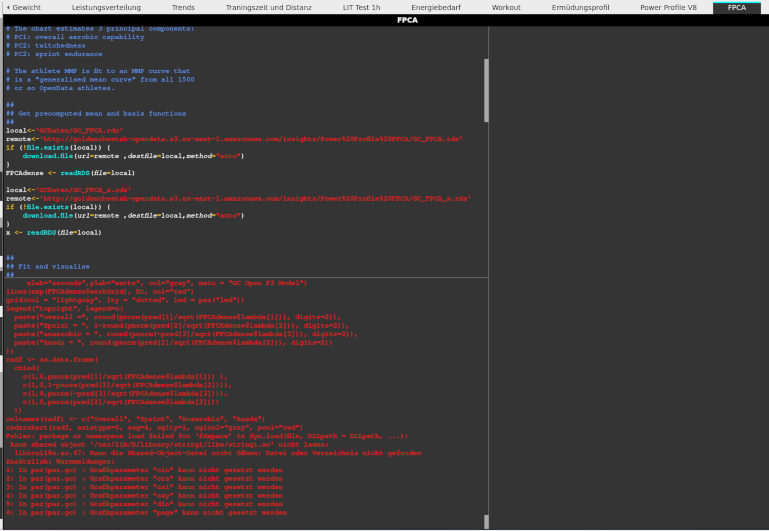
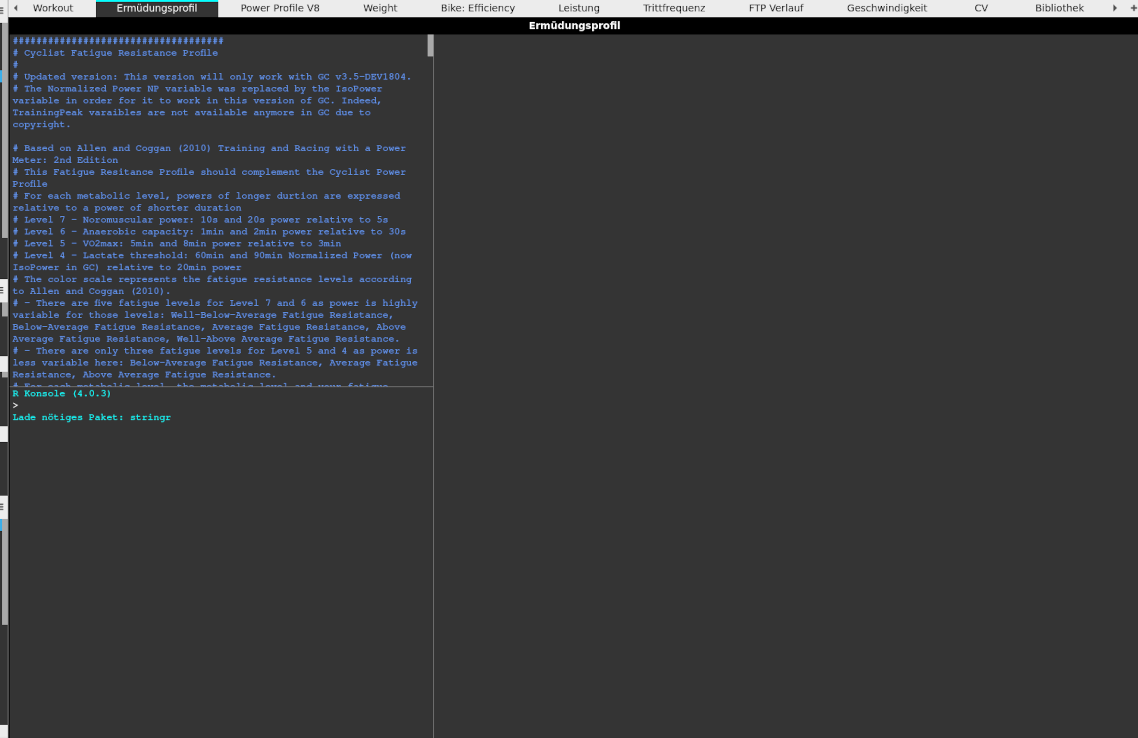
The R Chart Bike Fatigue Profile and FPCA are not loaded.
The Chart Cyclist profile works. All charts are from the cloud.
The Chart Cyclist profile works. All charts are from the cloud.
With the Linux AppImage instalation.

Ale Martinez
Jan 8, 2021, 7:07:59 AM1/8/21
to golden-cheetah-users
El jueves, 7 de enero de 2021 a la(s) 20:51:49 UTC-3, rjmc...@gmail.com escribió:
Mark, prior to running the January 2021 build, should I have uninstalled previous installations of Python or R?I had installed Python 3.6.4 a year or so ago before it was built into the GC installer along with a many of the modules (numpy, pandas, scipy, scikit learn, tensorflow, lmfit, colour, plotly) that were necessary for many of the charts.The January 2021 build seems to be running properly, but I have tried some of the curated charts and only see blank screens while other charts are running fine.When I click on the "Help" Menu in Golden Cheetah, then "About Golden Cheetah", then "Version" Tab, I see:R 3.5.2 [4.0.3]Python 3.7.7 [3.7.9]When I enter "python --version" in the Windows Command Prompt, I get: Python 3.6.4
As indicated in the release paragraph “Embedding”
- R versions supported are from 3.4 to 4.0
- Python version supported is 3.7 with SIP 4.19.8
So R 3.5.2 should work without changes, for Python you can use the included one, or install your own 3.7 if you want to install additional packages, as explained in: https://github.com/GoldenCheetah/GoldenCheetah/wiki/UG_Special-Topics_Working-with-Python
Ale Martinez
Jan 8, 2021, 8:37:41 AM1/8/21
to golden-cheetah-users
El viernes, 8 de enero de 2021 a la(s) 04:50:38 UTC-3, marcen escribió:
The R Chart Bike Fatigue Profile and FPCA are not loaded.
I checked both charts work using this AppImage on Ubuntu with R 3.6.3
The error messages seems to indicate some problem with installed packages, do these charts work with v3.5?
marcen
Jan 8, 2021, 8:57:40 AM1/8/21
to golden-cheetah-users
Sorry my mistake I thought I was using R from AppImage but I have R installed.
Yes the packs were missing.
Yes the packs were missing.
marcen
Jan 8, 2021, 10:32:37 AM1/8/21
to golden-cheetah-users
Installed the packages. Now I have no more error message.
But the chart is not loaded.
Any idea what else I can check?
I have no other error messages.
But the chart is not loaded.
Any idea what else I can check?
I have no other error messages.
Ale Martinez
Jan 8, 2021, 6:34:50 PM1/8/21
to golden-cheetah-users
El viernes, 8 de enero de 2021 a la(s) 12:32:37 UTC-3, marcen escribió:
Installed the packages. Now I have no more error message.
But the chart is not loaded.
Any idea what else I can check?
I have no other error messages.
I can't read german, but Google Translate says "Lade nötiges paket: stringr" means "Load required package: stringr", likely this one: https://www.rdocumentation.org/packages/stringr/versions/1.4.0
Just to be clear: R integration has not changed from v3.5 to v3.6 and you can use the same R version as before, if you have issues with a particular chart please search the forum for previous threads on that chart or, eventually, open a new one, may be the author or other R programmers can help you.

Alan Benstead
Jan 16, 2021, 12:09:35 PM1/16/21
to golden-cheetah-users
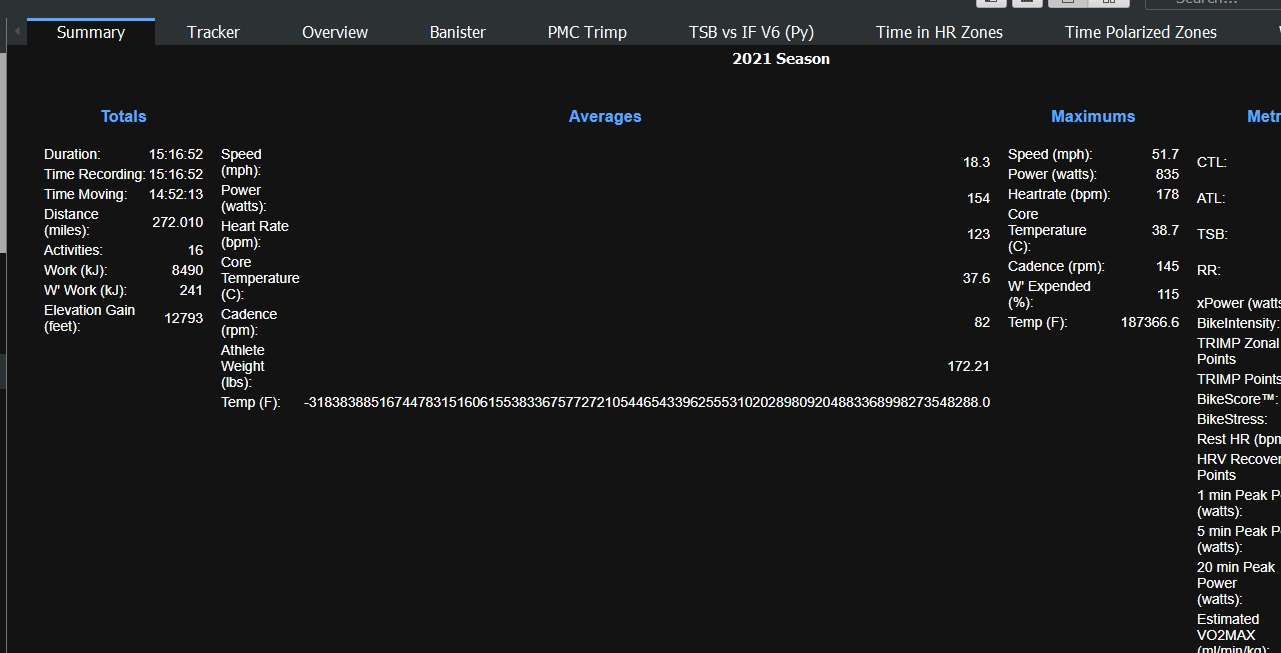
I am having an issue with GC closing when I try and view the Activities-Overview tab. It happens after adding a new ride, once GC is re-opened I can view the Overview tab without any issues. I also noticed that the Trends-Summary tab is having an issue with the display of temperature, see attached screenshot.
Regards
Alan
Ale Martinez
Jan 16, 2021, 3:07:04 PM1/16/21
to golden-cheetah-users
Overview chart is default one or have you customized or added some tiles?
WRT temperature we need to look at the original file if you can zip attach it, otherwise look at Details > Raw Data to check for data anomalies
Alan Benstead
Jan 16, 2021, 4:04:33 PM1/16/21
to golden-cheetah-users
Hi Ale,
WRT to the temperature, I went through the Raw Data and did find some anomalies. That issue is resolved.
I did add some tiles and also a customized tile to the Overview display. Most of them are a standard selection options except the one for Ride Zone. I have added screenshots of my Overview tab plus the customized tile. As I said before, GC normally closes when I first select the Overview Tab and then is good from there on until I add a new ride.
Thanks
Alan
Ale Martinez
Jan 16, 2021, 4:19:34 PM1/16/21
to golden-cheetah-users
El sábado, 16 de enero de 2021 a la(s) 18:04:33 UTC-3, alan.b...@yahoo.com escribió:
Hi Ale,WRT to the temperature, I went through the Raw Data and did find some anomalies. That issue is resolved.I did add some tiles and also a customized tile to the Overview display. Most of them are a standard selection options except the one for Ride Zone. I have added screenshots of my Overview tab plus the customized tile.
If you use Export Chart from the chart menu a .gchart file will be generated which is useful to try to reproduce the issue.
As I said before, GC normally closes when I first select the Overview Tab and then is good from there on until I add a new ride.
That is a crash, when this happens a crash*.log file is created in GC folder which may help to debug.
Ale Martinez
Jan 17, 2021, 3:30:03 PM1/17/21
to golden-cheetah-users
Thanks, the crash log is not very informative but I can reproduce the crash using that Overview chart, the sb(TRIMP_Points) call seems to be provoking it, but I don't understand why, yet.
El sábado, 16 de enero de 2021 a la(s) 21:56:20 UTC-3, alan.b...@yahoo.com escribió:
Here are the files.
Alan Benstead
Jan 17, 2021, 7:05:03 PM1/17/21
to golden-cheetah-users
It is good that you can reproduce the crash, makes it a little easier to solve hopefully.
Ale Martinez
Jan 18, 2021, 7:15:05 AM1/18/21
to golden-cheetah-users
El domingo, 17 de enero de 2021 a la(s) 21:05:03 UTC-3, alan.b...@yahoo.com escribió:
It is good that you can reproduce the crash, makes it a little easier to solve hopefully.
In theory yes, in practice It looks like a difficult to debug problem happening when you use sb(xxx), or any other pmc related function, in a tile formula and the sub-formula xxx is being computed.
Ale Martinez
Feb 11, 2021, 7:29:45 PM2/11/21
to golden-cheetah-users
Even when the new Overview chart is very intuitive, I think some documentation may help to promote their use:
- Overview in Activities View: https://github.com/GoldenCheetah/GoldenCheetah/wiki/UG_ChartTypes_Activities#Overview
- Overview in Trends View: https://github.com/GoldenCheetah/GoldenCheetah/wiki/UG_ChartTypes_Trends#Overview
Feel free to share your dashboard designs if you have interesting ones.

Will
Feb 14, 2021, 11:14:00 AM2/14/21
to golden-cheetah-users
I'm not sure if this is helpful or not, but I've had issues with crashes on the past few development builds where it will get to the end of the loading (which goes faster than it used to) and then crash every time. I'm running the x64 on Windows 10 with a reasonably powerful but 6 year old computer (970 Ti, core i7 4 GHZ with 16 GB ram). I've reverted back to 3.5 release again and it's working. I'm not sure if there's an ini file or something that I need to adjust or delete, or if there's a problem. I don't get a crash record because it doesn't get that far.
Thanks,
Will
Message has been deleted
Ale Martinez
Feb 14, 2021, 1:10:13 PM2/14/21
to golden-cheetah-users
El domingo, 14 de febrero de 2021 a la(s) 13:14:00 UTC-3, Will escribió:
I'm not sure if this is helpful or not, but I've had issues with crashes on the past few development builds where it will get to the end of the loading (which goes faster than it used to) and then crash every time.
Faster than usual load (0-100% popup) typically happens when cache/rideDB.json load is aborted, for example due to being outdated, followed by a resource consuming cache recomputation.
I'm running the x64 on Windows 10 with a reasonably powerful but 6 year old computer (970 Ti, core i7 4 GHZ with 16 GB ram). I've reverted back to 3.5 release again and it's working. I'm not sure if there's an ini file or something that I need to adjust or delete, or if there's a problem.
To diagnose a config file problem you could remove (after backup) usermetrics.xml, start GoldenCheetah.exe -- from a command prompt to create a new athlete and import a couple of files.
I don't get a crash record because it doesn't get that far.
If the above test also fails the main suspects are:
- Runtime libraries: reinstall following the 3 steps at the end of https://github.com/GoldenCheetah/GoldenCheetah/releases/tag/v3.6-DEV2101

Ricardo Matias
Apr 6, 2021, 10:33:33 AM4/6/21
to golden-cheetah-users
Hi,
I have an issue with the version 3.6. Previously, I had installed the 3.5 version and never had this problem. On Trends/Tracker Chart, the date range filter only works partially. For example, if I select the current year, I only get January 2021.
I have an issue with the version 3.6. Previously, I had installed the 3.5 version and never had this problem. On Trends/Tracker Chart, the date range filter only works partially. For example, if I select the current year, I only get January 2021.
Besides that, If I go to Chart Settings, I can't edit, add or remove any curve.
Ale Martinez
Apr 6, 2021, 10:57:31 AM4/6/21
to golden-cheetah-users
El martes, 6 de abril de 2021 a la(s) 11:33:33 UTC-3, ricardo...@gmail.com escribió:
Hi,
I have an issue with the version 3.6. Previously, I had installed the 3.5 version and never had this problem. On Trends/Tracker Chart, the date range filter only works partially. For example, if I select the current year, I only get January 2021.
See the Note about Data Table in: https://github.com/GoldenCheetah/GoldenCheetah/wiki/UG_ChartTypes_Trends#metric-trends
Message has been deleted
Ale Martinez
May 5, 2021, 6:37:50 PM5/5/21
to golden-cheetah-users
El lunes, 18 de enero de 2021 a la(s) 09:15:05 UTC-3, Ale Martinez escribió:
El domingo, 17 de enero de 2021 a la(s) 21:05:03 UTC-3, alan.b...@yahoo.com escribió:It is good that you can reproduce the crash, makes it a little easier to solve hopefully.In theory yes, in practice It looks like a difficult to debug problem happening when you use sb(xxx), or any other pmc related function, in a tile formula and the sub-formula xxx is being computed.
This issue is fixed in last snapshot builds, they work using simple formulas like sb(BikeStress) or more complex like sb(BikeStress ?: TRIMP_Zonal_Points).
Alan Benstead
May 6, 2021, 11:58:10 AM5/6/21
to golden-cheetah-users
Unfortunately I am not able to take advantage of the fix by moving to the latest snapshot. I am using the Jan 5 Dev build until Wahoo resolve (if they ever will!) the L/R pedal balance issue in their FIT file.
Reply all
Reply to author
Forward
0 new messages