Polarised Zones
1,444 views
Skip to first unread message

Mark Liversedge
Feb 15, 2014, 6:28:17 AM2/15/14
to golden-che...@googlegroups.com
Hi,
Quick note to say I've added the option on historam to plot power in the polarised zones.

I've chosen to call them 'moderate', 'heavy' and 'severe' as per the literature. Since we don't set values for LT1/VT1 and LT2/VT2 (MLSS) I've coded it up to use Z1+Z2 for moderate, Z3 thru CP for heavy and anything over CP for severe.
If we find this isn't sufficient we can look at a more sophisticated approach, but for now it gives a good indication of the distribution of effort to identify the mix of your past training. When we rewrite measures I'll be adding the ability to record and utilise power at VT1/VT2/MLSS/OBLA etc etc
Also, to be very clear; these zones are for *reviewing* training, the normal zones are still there for *planning* training. I'm sorry for saying this its just that some folks have missed this distinction.
Oh, it works in compare mode too so you can compare past seasons/phases to see how your mix may have changed. Thats what the screen grab is showing above.
Cheers,
Mark

massarob
Feb 15, 2014, 11:14:08 AM2/15/14
to golden-che...@googlegroups.com
very good idea, I was trying something "similar" with the normal levels to check my past "polarization"


Ale Martinez
Feb 15, 2014, 11:56:08 AM2/15/14
to golden-che...@googlegroups.com
Nice feature Mark!
WRT to the zones mapping, I think our Z3 should be considered in the moderate/green/below VT1/LT1 bucket, at least until LT1/VT1 power/hr becomes configurable, these slides from Seiler's presentation shows a similar mapping:


Ale.
Mark Liversedge
Feb 15, 2014, 4:13:22 PM2/15/14
to golden-che...@googlegroups.com
I am happy to take advice on this... but to explain my choices...
The original paper talks of the aerobic and anaerobic thresholds before quantifying them in terms of 3 intensity zones; low lactate, lactate accommodation and lactate accumulation.
LT2 The high marker is obviously MLSS and we know this is "slightly below CP", but typically the same as MMP60*. I used CP anyway, since it is "close enough" and aligns nicely with the severe and heavy exercise domains (Prof Seiler's paper is being discussed at the moment but this feature is for the longer term).
LT1 Reading the text closely you will see that the low end is supposed to represent the aerobic threshold (Seiler refs Zindermann who pegs it at 2mmol), but in the chart you see it at 2.4mmol. Which is perhaps 1mmol above a 1.5mmol baseline for the participants of the study (aka Farrell).
So that's why I chose where I did - the aerobic threshold at roughly 75% of MMP60. I will confess the symmetry of the zone distribution appealled, perhaps wrongly. And it means we can use moderate, heavy and severe to describe the zones.
I also just watched Prof Seiler's presentation through again, to see if I was misrepresenting him (I will send an email and ask) it's here: http://www.canal-insep.fr/fr/training-periodization-deep-root-cultural-heritage-and-innovative-paradigms-2013/ei_13_10_va_pr_stephen_seiler-mov he says that Zone 3 is the "lactate threshold range" and 1mmol above baseline. He also provides numerous illustrations in his presentation regarding 'low intensity'/'basic endurance' and 'high intensity' and talks about athletes not working in the 'pretty hard middle intensities'. Indeed, the vast majority f the data he shows isn't even in zone 2 of the 5 zone model -- its all pretty much volume in zone 1. So I felt this validated the choice.
Also, all of your data is still being represented -- we know that tempo/threshold training is all in the middle bar.
Mark
* and most users are configuring CP as MMP60/"FTP" anyway (including me).
Mark Liversedge
Feb 16, 2014, 4:53:41 PM2/16/14
to golden-che...@googlegroups.com
I read the review, and was taken by this:
I think the central question here is perhaps how we quantify that 'accuracy of training execution' in terms of the athletes ability to stay on plan. Did they avoid that black hole of low intensity becoming tempo and high intensity falling back into threshold ?
But just as vestiges reside in species, high performance training programs contain residual imperfections. The current paper highlights, in my opinion, the most common mistake: the accuracy of training execution. Specifically, this paper supports my own observation that for endurance athletes (particularly middle-distance), low-intensity training is performed too high whilst high-intensity training is performed too low. I surmise that the latter is a product of the former. The case studies illustrate the effects of including higher volumes of accurately performed low-intensity training It is not clear whether low-intensity training is more effective than high intensity training or whether low-intensity work simply allows more rapid recovery and preserves high intensity systems for performance of high-end work.
I think the central question here is perhaps how we quantify that 'accuracy of training execution' in terms of the athletes ability to stay on plan. Did they avoid that black hole of low intensity becoming tempo and high intensity falling back into threshold ?
Aside from worrying about the low marker (which I suspect needs to be bumped up a notch, AC makes some great points about this on wattage) perhaps we should think about how we measure athlete discipline and training execution accuracy ?
Mark
Ale Martinez
Feb 17, 2014, 6:15:03 PM2/17/14
to golden-che...@googlegroups.com
Mark, sorry but I don't understand why you need to define your own mapping different from Seyler's mapping, at least from his 2009 paper up to the referenced presentation, he maps the zone 2 in the norwegian system, which is the analogous of GC Z3, to below VT1/LT1:
The 5-zone scale in the table above and the 3-zone scale below are reasonably super-imposable in that intensity Zone 3 in the 5-zone system coincides well with Zone 2 in the 3-zone model. from: http://sportsci.org/2009/ss.htm#_Toc245522381
Also Coggan seems to agree his L3 (GC Z3) falls mostly below VT1/LT1: https://groups.google.com/d/msg/wattage/Xr_PgQLRh9c/ukCD6sjZ09cJ
Ale Martinez
Feb 17, 2014, 6:22:13 PM2/17/14
to golden-che...@googlegroups.com
>Aside from worrying about the low marker (which I suspect needs to be bumped up a notch, AC makes some great points about this on wattage) perhaps we should >think about how we measure athlete discipline and training execution accuracy ?
I think a simple but interesting step forward would be to use the 30s MA power (if you prefer NP) or the 25s EWMA power (if you prefer xPower) instead of raw power to compute time in zones, as a simple way to account for VO2 kinetics.
Mark Liversedge
Feb 17, 2014, 6:29:16 PM2/17/14
to golden-che...@googlegroups.com
I do agree, and in fact, I mentioned in a post above.
I wonder about the disparity between the 2004 paper and the 2013 presentation and the utility of such a narrow zone.
I'd probably just hard-code the zones 0-95%, 95%-100%, 100%+
Any bright ideas about what to call them ?
Mark
Mark Liversedge
Feb 17, 2014, 6:35:29 PM2/17/14
to golden-che...@googlegroups.com
On Monday, 17 February 2014 23:29:16 UTC, Mark Liversedge wrote:
I'd probably just hard-code the zones 0-95%, 95%-100%, 100%+
Brain fart. 85% not 95%.
Message has been deleted
Mark Liversedge
Feb 17, 2014, 7:16:49 PM2/17/14
to golden-che...@googlegroups.com
Well I've made those changes and pushed.
I'm not convinced tbh. But hey lets go with it.

Cheers,
Mark
On Monday, 17 February 2014 23:15:03 UTC, Ale Martinez wrote:
On Monday, 17 February 2014 23:15:03 UTC, Ale Martinez wrote:
Mark Liversedge
Feb 18, 2014, 1:58:47 PM2/18/14
to golden-che...@googlegroups.com
On Monday, 17 February 2014 23:15:03 UTC, Ale Martinez wrote:
Mark, sorry but I don't understand why you need to define your own mapping different from Seyler's mapping, at least from his 2009 paper up to the referenced presentation, he maps the zone 2 in the norwegian system, which is the analogous of GC Z3, to below VT1/LT1:The 5-zone scale in the table above and the 3-zone scale below are reasonably super-imposable in that intensity Zone 3 in the 5-zone system coincides well with Zone 2 in the 3-zone model. from: http://sportsci.org/2009/ss.htm#_Toc245522381Also Coggan seems to agree his L3 (GC Z3) falls mostly below VT1/LT1: https://groups.google.com/d/msg/wattage/Xr_PgQLRh9c/ukCD6sjZ09cJ
Reading AC's comment again I see it as directly in relation to the blood lactate measure and not related to the reference in the text to VT1/LT1. LT1 is generally regarded as the boundary of aerobic metabolism. Also, bear in mind those 2mmol blood lactate measures are for elite athletes performing cross-country ski-ing (a full body exercise) !
I'm still not sure we've got it right. 85% of 60min MMP for 3 hours is a *bloody hard* workout. Consider that when reading this post from Prof Seiler on slowtwitch when they discussed this:
"I also am still of the opinion that 3 zones works quite well for most people: Green zone (talking intensity, starts feeling like you are working after an hour, feel like eating as soon as you are finished, Yellow Zone (threshold, typical zone for those 45-60 minute workouts you hustle to squeeze in after work, pretty tough workout, but you did not have to go near your personal cellar of mental fortitude to finish), Red zone (requires mental mobilization, clear increasing perception of effort with every interval bout, no appetite for about an hour after training). And of course the most common training mistake is that a green zone session becomes yellow because of half wheeling, and the next day's planned red zone session fades to uhhhh....pink. Show me a champion and I will show you a person with intensity discipline who plans the work and works the plan, even on days when someone rides past them that they know they could reel in :-) "
Cheers,
Mark
Mark Liversedge
Feb 18, 2014, 3:08:25 PM2/18/14
to golden-che...@googlegroups.com
AC has clarified on wattage and actually looking at the AIS and Seiler zones it looks like that middle zone 3 is at about 90% of FTP after all!


So maybe leave it alone for now :)
Mark
Mark Liversedge
Feb 18, 2014, 3:29:00 PM2/18/14
to golden-che...@googlegroups.com
On Tuesday, 18 February 2014 20:08:25 UTC, Mark Liversedge wrote:
AC has clarified on wattage and actually looking at the AIS and Seiler zones it looks like that middle zone 3 is at about 90% of FTP after all!
I should have explained that since vo2max is sport specific, and XC skiiing elicits the very highest vo2max then you need to adjust the right hand side to get the left. I reckoned cycling (top vo2 88) was roughly 90% of XC skiing (top vo2 of 96).
Greg Lemond doesn't count. He is a freak :)
Mark
Ale Martinez
Feb 18, 2014, 3:29:45 PM2/18/14
to golden-che...@googlegroups.com
That was my initial observation: if you agree the upper bound is FTP it follows straight from the 5-zones definition lower bound should be around 90% FTP.
WRT to Coggan's comment about power variability invalidating time-in-zone I think it could be alleviated using smoothed power (30s MA or 25s EWMA) instead of raw power, for the same reasons it is used in NP/xPower.
Mark Liversedge
Feb 19, 2014, 6:49:44 AM2/19/14
to golden-che...@googlegroups.com
On Tuesday, 18 February 2014 20:29:45 UTC, Ale Martinez wrote:
That was my initial observation: if you agree the upper bound is FTP it follows straight from the 5-zones definition lower bound should be around 90% FTP.
I asked Prof Seiler for guidance in an email and rather graciously he has provided some:
Linking the power meter approach to training zones with the 3 intensity zone model that I advocate for recreational and masters athletes is an interesting issue. I do not have a standard answer for example regarding the power output range that would make up the threshold zone. Physiologically, you need some blood lactate profiling to make good recommendations at the individual level.
But, we could probably come up with some reasonable estimates for different athlete populations and this could be a worthwhile research project to do!I suspect the gap from first lactate turn point power to Maximal lactate steady state power for most athletes is 30-50 watts, but I really want to go into some old test data we have and see if I can make some more educated estimates. The problem is that heart rate drift and other factors also impact the power to Heart rate/Bla relationship over the course of a long training session. So, testing data acquired right after a 20 min warm-up may not add up perfectly with performance after 90 minutes of riding.
So taking that best guess of 30-50w below MLSS we get a chart like this:
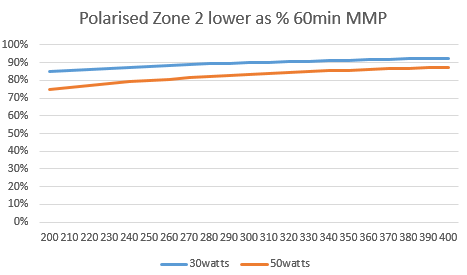
90% is the high end and 75% is the low end. Since 'most cyclists' fall within the range 250-310w for MMP I think pegging it at 85%, where we have it now, is probably good enough!
Mark
Ale Martinez
Feb 19, 2014, 12:13:04 PM2/19/14
to golden-che...@googlegroups.com
Mark, yes, probably good enough but, since the same considerations based on fitness level would apply to the boundary between L2/L3, which is already configurable with a 90% default, IMHO a better choice would be to use it instead of a hardwired value.
Ale Martinez
Feb 19, 2014, 1:14:47 PM2/19/14
to golden-che...@googlegroups.com
L2/L3 was a mistake, I am proposing to use L3/L4 boundary instead of a fixed value.
Mark Liversedge
Aug 10, 2014, 5:48:17 PM8/10/14
to golden-che...@googlegroups.com
Hi Ale,
I've been drawn back to this recently and in the talk and papers Prof Seiler consistently refers to 2/2.5-4 mmol as the middle zone.
We currently translate this to between 85-100% of CP .. I'm minded it should be 75-100%.
Mark
Mark Liversedge
Aug 10, 2014, 5:57:33 PM8/10/14
to golden-che...@googlegroups.com
Scrub that.
Looking at the correspondence again I can see that 85% is fine .. since it chimes with the 30-50 watts rule of thumb given, for a typical range of CP :)
Sorry.
Mark

Rohan
Aug 11, 2014, 11:10:48 PM8/11/14
to golden-che...@googlegroups.com
Will it be able to be customised? I'm personally working on 75% as my Z1/Z2 boundary point.
Mark Liversedge
Aug 12, 2014, 2:55:33 AM8/12/14
to golden-che...@googlegroups.com
On Tuesday, 12 August 2014 04:10:48 UTC+1, Rohan wrote:
Will it be able to be customised? I'm personally working on 75% as my Z1/Z2 boundary point.
I think that might be the only way .. maybe have multiple zone schemes :(
Ack.
Mark
Mark Liversedge
Sep 8, 2014, 3:09:25 AM9/8/14
to golden-che...@googlegroups.com
Might be worth adding polarized zones when plotting HR distribution, based upon this exchange.
I'd say that definitely places Polarized Z1 below tempo, at least it does for me.

Mark
Ale Martinez
Nov 17, 2014, 8:59:59 AM11/17/14
to golden-che...@googlegroups.com
In the next days I will try to add Polarized Zones for HR and Pace, I was thinking to use 90%LTHR for zone I upper bound since it is a nice round number which gives ~80%HRmax when LTHR is ~90%HRmax, for pace 90%CV, in both cases near the middle of Tempo zone.

Diego Cattaneo
Jan 20, 2021, 4:48:30 AM1/20/21
to golden-cheetah-users
Hello. I'm a little bit late here.
Is the customization available?
Actual boundaries for I II and III zones are 85% and 100% of CP?
Thanks
Ale Martinez
Jan 20, 2021, 7:04:53 AM1/20/21
to golden-cheetah-users
El miércoles, 20 de enero de 2021 a la(s) 06:48:30 UTC-3, dcat...@gmail.com escribió:
Hello. I'm a little bit late here.Is the customization available?
Actual boundaries for I II and III zones are 85% and 100% of CP?
Yes, it’s documented in the wiki
Reply all
Reply to author
Forward
0 new messages