Open API for R, Matlab/Octave etc

Mark Liversedge

Above I have started the GoldenCheetah API server and connected from R studio, retrieved a ride and plotted it.
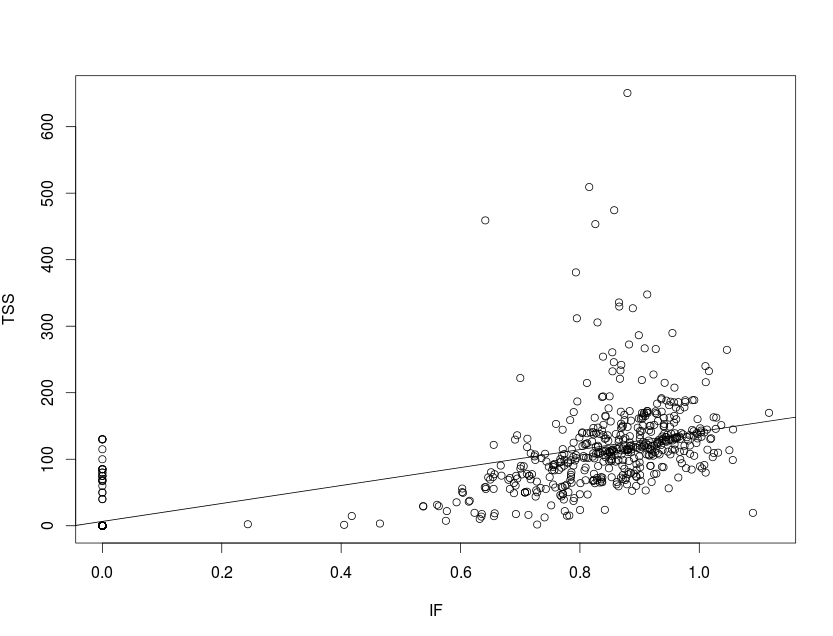
By way of example, below are the meanmax power bests and IF/TSS metrics for all rides for this athlete, using similar approaches:

You will see that from R (for example) you can connect to the server and retrieve data using the RCurl package in a couple of lines e.g;
library(RCurl)
bests <- read.csv(text=getURL("http://localhost:12021/athlete/bests?series=watts&since=2014/01/01&before=2014/12/31"))
plot(secs, watts)
Endpoint Descriptions
The endpoints and parameters are as follows;
1. List Athletes
Will list all the athletes and their basic info (weight, height, date of birth, sex et al)
2. List Activities and Metrics
http://localhost:12021/athletename
Will list all rides and all metrics for the named athlete. The following parameters can be used to limit the output;
since=yyyy/mm/dd
before=yyyy/mm/dd
metrics=NP,IF,TSS,AveragePower ... etc
3. Fetch an Activity
http://localhost:12021/athletename/activity/filename
Will retreive the activity (by default in json format) the format can be specified in a parameter;
format=xxx where xxx is one of csv, tcx, json, pwx
4. Fetch Mean Maximal Data
http://localhost:12021/athlete/meanmax/activity
Will fetch the meanmax for a specific activity, by default it will retreive power, but can specify using a parameter;
series=xxx where xxx is one of watts,hr,cad,speed,nm,vam.xPower,NP
5. Fetch Mean Maximal Bests
http://localhost:12021/athlete/meanmax/bests
Will fetch the very best MM data for a date range, by default it will fetch for all dates, but you can specify using a parameter;
since=yyyy/mm/dd
before=yyyy/mm/dd
series=xxx where xxx is one of watts,hr,cad,speed,nm,vam.xPower,NP
6. Fetch Configured Zone parameters
http://localhost:12021/athlete/zones
Will fetch the zones config, by default for power (CP,W', Pmax over time) but you can specific using a parameter;
for=xxx where xxx is one of power, hr, pace, swimpace
We will no doubt add more endpoints and some samples/tutorials on working with them from matlab and R.
Most interestingly, researchers are increasingly publishing their algorithms and code using R and Matlab ... making it easy for us to use it ahead of any special development. A good example would be the core temperature algorithm that was implemented in GC v3.2.
Mark

Ruud Goorden
Mark Liversedge


mike veloclinic

Karl Billeter
> Mark,
>
> I can get R to read the list of athletes from GC. For athletes with only a
> couple activities it will also read the list of activities and will read an
> individual activity. However, if I have an athlete with more than just a
> few activities I get:
>
> > activities <- read.csv(text=getURL("http://localhost:12021/mike p"))
> > activities
> [1] X413.Entity.too.large
> <0 rows> (or 0-length row.names)
Karl
Karl Billeter
> I can't seem to get bests to work even on the athletes with just a few
> activities where everything else works. I've tried a few different
> variations but get something like this each time:
>
> > library(RCurl)
> > bests <-
> read.csv(text=getURL("http://localhost:12021/doug/bests?series=watts&since=2014/01/01&before=2015/12/31"))
> > attach(bests)
Karl
Mark Liversedge
Mark Liversedge
mike veloclinic

Nathan Townsend
Mark Liversedge
I've got the API working as it creates an object of bests in the environment window, but having difficulty getting it to plot meanmax. Any suggestions?

Mark Liversedge
No problems when I run list athletes (see attached), but if I enter any of those athlete names then I get nothing for meanmax/bests in the browser
Mark Liversedge
Nathan Townsend
Nathan Townsend
On Thursday, 19 November 2015 17:14:05 UTC+3, Nathan Townsend wrote:
Opens a tab called "Redirecting", but there is nothing there. It's just a blank white page.
Nathan Townsend
On Thursday, 19 November 2015 17:14:05 UTC+3, Nathan Townsend wrote:Opens a tab called "Redirecting", but there is nothing there. It's just a blank white page.and in R, opening the"bests" object shows no data either. It says "unknown.series.requested" then "No data available in table"
Mark Liversedge
On Thursday, 19 November 2015 17:14:05 UTC+3, Nathan Townsend wrote:Opens a tab called "Redirecting", but there is nothing there. It's just a blank white page.

Ale Martinez

Mike Patton
Mark Liversedge
Any chance that the various CP model parameters could be made available in the same way that Bests are available? It would be really helpful to be able to specify the time ranges and model used in the same way they can be specified in the dialog box within GC. Am I better to raise a feature request than post here?
Mike Patton
The model estimates are generated and not stored, the CP/Pmax/W'/zone config are available.What are you looking to achieve?
We /could/ and /want/ to update the modelling side to store estimates, that way we don't have a startup delay.
We /could/ and /should/ enable you to use the models via the API (regardless of athlete).
Mark Liversedge
Ruud Goorden
Mark Liversedge
Been trying to use R, the but for some reason I can't connect to the localhost. The API is enabled in GC. Also typing in the URL on internet explorer won't give a result. Have sought quite extensively what reason could be but no luck untill now. Does anybody have some good tips (maybe somekind of small checklist / of most common basic setting issues (browser or proxy or...)?) so I can go through these? Would be really great
Ruud Goorden
By the way this one is nice as well:
https://cran.r-project.org/web/packages/trackeR/vignettes/trackeR.pdf
Mark Liversedge
Ruud Goorden
Mark Liversedge
O. Thats cycleRtools. That is another package than this one I am referring to. I thought this one would be an nice addition as well
Ruud Goorden
Error in function (type, msg, asError = TRUE)  :
Failed to connect to localhost port 12021: Connection refusedOp dinsdag 23 februari 2016 16:39:40 UTC+1 schreef Mark Liversedge:
Mark Liversedge
Unfortunately keep getting the error:Error in function (type, msg, asError = TRUE) : Failed to connect to localhost port 12021: Connection refusedAlso turned off firewall which did not help. Any other options? I mean also when I enter http://localhost:12021 in the browser it won't find it. Very Strange and frustrating :(

Ruud Goorden
Op woensdag 24 februari 2016 11:28:11 UTC+1 schreef Mark Liversedge: