"All Dates" Season in Trends Overview Tile

Allan Bell

Mark Liversedge
Allan Bell
#limit the date range
start <- daterange(start) < "2015/08/06" ? "2015/08/06" : daterange(start);
end <- daterange(stop) > Today ? Today : daterange(stop);
YY <- end - start +1;
Then everything works as expected, but it's strange that the All Dates season doesn't work properly as per wiki in those Overview Chart Tiles.
NOTE: The season All Dates is automatically created and ranges from the first to the last activity available.
Mark Liversedge
Allan Bell
NOTE: The season All Dates is automatically created and ranges from the first to the last activity available.
So I assumed that when I select the season All Dates the value in daterange(start) would be the date of my first activity in GC and the value in daterange(stop) would be the most recent activity or Today.
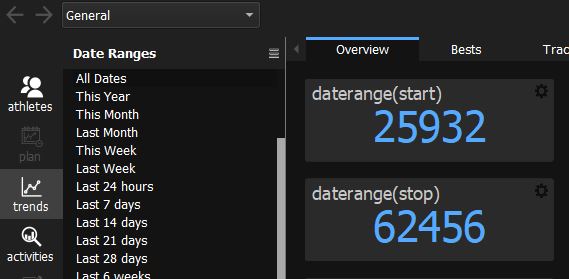
But that doesn't happen. When I select the season All Dates, daterange(start) = 30/12/1970 and daterange(stop) = 29/12/2070
(these values were in the screen grab I sent)
This wouldn't be a problem if looking at totals within the season All Dates, but if calculating weekly or monthly values within the season All Dates then the daterange spans 100 years and weekly/monthy values are therefore incorrect.
For example if I have a KPI calculation for weekly distance on a trends overview screen:
days <- daterange(stop) - daterange(start);
round(sum(metrics(Distance))/(days/7));
When I select the season All Dates this returns (total overall distance) / (36524 days / 7)
As I mentioned, it's easy to get around by manually limiting the min value of daterange(start) and max value of daterange(stop) in the KPI calculation but I thought I should point this out as it seems to be inconsistent with the described behaviour in the user documentation.
Cheers
A.
Mark Liversedge
In the user documentation it says:NOTE: The season All Dates is automatically created and ranges from the first to the last activity available.